A/B Testing Calculator: Sample Size and Test Duration
See how an a/b testing calculator sets sample size and test duration, plus how to read significance without fooling yourself. Worked numbers included.

Most advice about an A/B testing calculator stops at the visitor count. Enter a baseline, a lift, a confidence level, and the tool tells you how many visitors you need. Then you run the test until you hit that number.
That is half the job. The visitor count says nothing about whether the lift you are chasing is worth the ad spend required to detect it. It says nothing about what happens when someone glances at the dashboard on day four and calls a winner, a habit that inflates your false-positive rate. And it ignores the fact that a listing win compounds, because better conversion on the same paid traffic lowers cost per order and reinforces the organic rank that traffic is already buying.
Many tests get killed or shipped for the wrong reason: the statistics look clean while the economics do not. A variant can win on paper and still lose money once you price in the sessions, the clicks and the weeks of suppressed conversion on the losing half of your traffic. Treat the calculator as a pricing tool for decisions rather than a traffic counter, and you stop paying for certainty you never needed.
Sample Size Benchmarks You Can Plan Around
Your main image converts near 10% and the replacement tested well with a small panel. Do you swap it? That question has a number attached, and the number isn't yes or no. It's how many visitors each variant needs before the gap between them means anything.
Start from the benchmark in the NIST/SEMATECH e-Handbook of Statistical Methods, which works a two-proportion planning example at a two-sided 5% significance level and 80% power on a 10% baseline. Detecting an increase from 10% to 11%, a 10% relative lift, takes roughly 14,749 visitors per variant. Detecting 10% to 12% takes about 3,839. Detecting 10% to 13% takes about 1,772. The same handbook is blunt about why: a very large sample can make a tiny difference statistically significant, while a small sample can fail to detect a difference that would have mattered commercially.
Visitors required per variant at 95% confidence and 80% power
| Baseline conversion rate | Relative lift | Visitors per variant |
|---|---|---|
| 5.0% | +10% | ~15,700 |
| 10.0% | +10% | 14,749 |
| 10.0% | +20% | 3,839 |
| 10.0% | +30% | 1,772 |
Three rules that save a tool run
- Halve the lift you want to detect and roughly quadruple the sample. On a 10% baseline, chasing +20% needs 3,839 visitors per variant while chasing +10% needs 14,749. Half the effect, nearly four times the traffic.
- A higher baseline needs fewer visitors for the same relative gain. Detecting +10% from a 5% baseline takes about 15,700 per variant; the same relative jump from 10% takes 14,749. Small baseline differences swing the requirement more than is commonly assumed.
- Every figure is per variant, so double it for total traffic. A 14,749 target is 29,498 visitors across the experiment. Add a third cell and it needs its own full allocation.
The assumptions in one line: two-proportion comparison, two-sided test, 95% confidence, 80% power. Change any of them and every row moves.
Check before you commit: compare the target against your actual unique-visitor count for the last 30 days. If the number is out of reach, that's a finding, not an inconvenience.
What you hold now is a sample target you can test against real traffic before a single visitor sees the variant. That's a different asset from a feeling about when to stop. If you're unsure the baseline you're planning from is normal for your category, compare your store's conversion rate against published benchmarks first.
How to Fill In Each Calculator Field
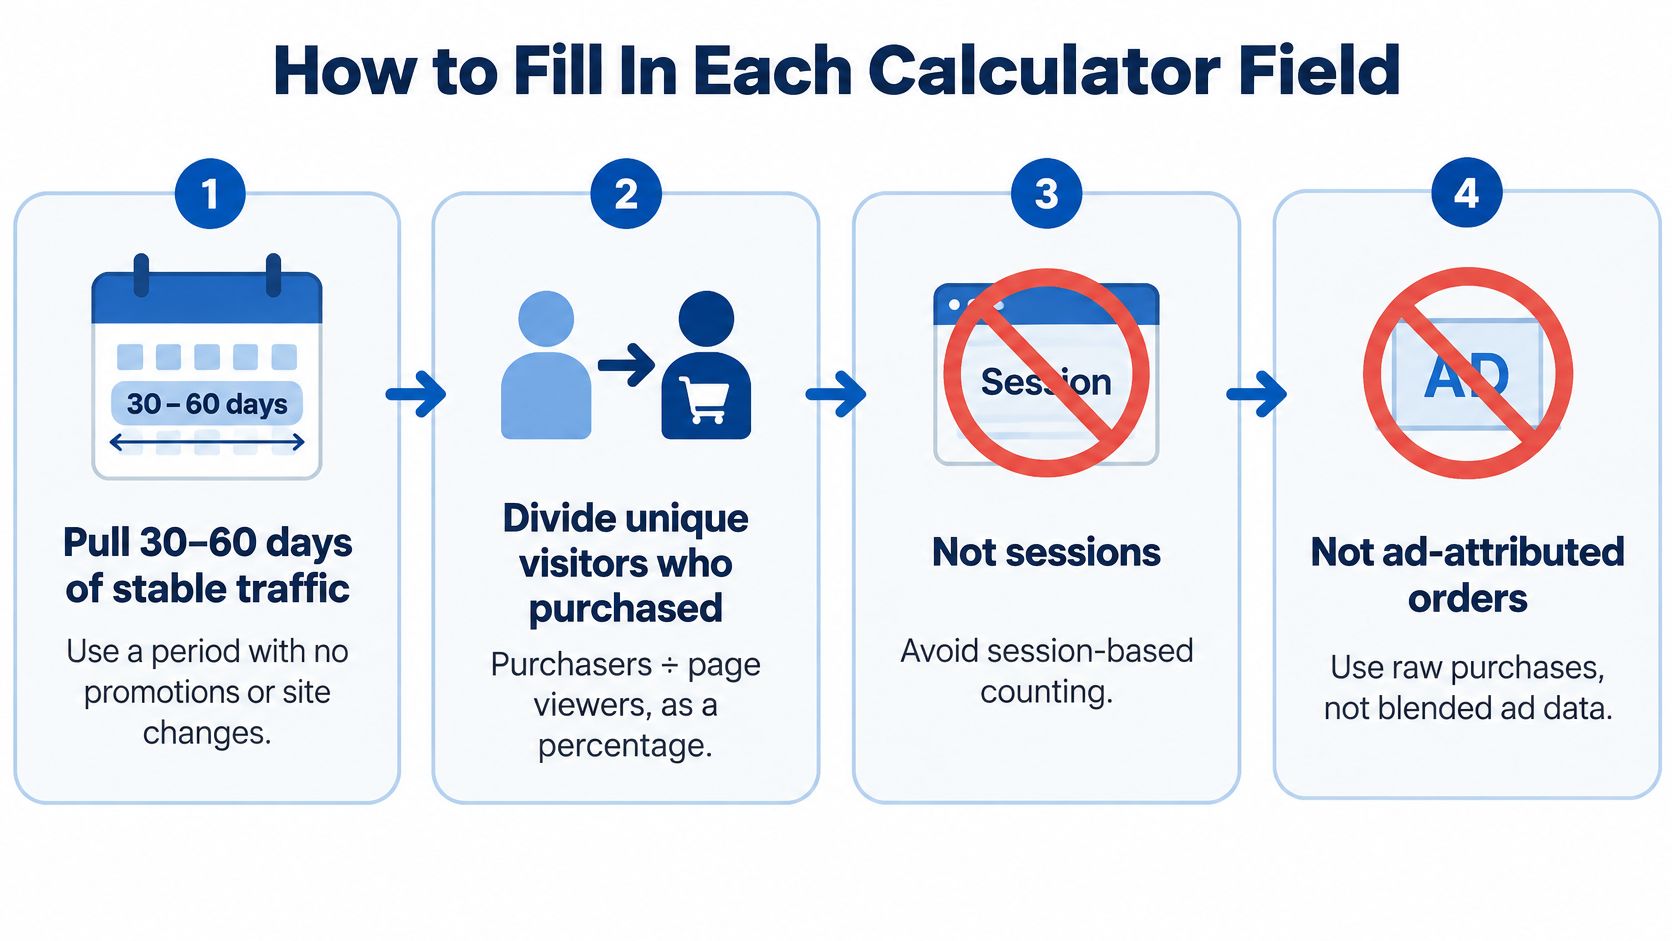
Six fields decide the whole calculation, and most get filled in from memory. That is how tests end up sized wrong before a single visitor arrives.
Fill the fields in this order
- Baseline conversion rate. Pull 30 to 60 days of stable traffic with no promotions, coupons, or price changes inside the window. On a listing, that is sessions against ordered units, the unit session percentage in your business reports, rather than ad-attributed orders or account-wide averages.
- Minimum detectable effect. Derive it from unit economics: contribution margin per unit times the extra orders a lift would create, weighed against the traffic the test consumes. If the lift you can detect would not pay for the spend it takes to find, enter a bigger effect or pick a bigger lever. The scale worth chasing shows up in creative work: in Headline's home goods brand case study, A/B tests of lifestyle images against product-only images improved click-through rates by 34%.
- Significance level. Keep 95% two-sided for anything a shopper sees. Dropping to 90% buys a smaller sample by making false positives cheaper, which is a bad trade on a listing that stays live for months.
- Power. 80% is the floor. Move to 90% or 95% when the test is slow or expensive, because a slow test is the one you can least afford to rerun.
- Traffic per variant. Count ordinary weeks. Prime Day and Q4 spikes inflate the daily number and skew the sample you are collecting.
- Number of variants. A/B/n splits the same visitors three or four ways, so each extra cell takes traffic from the others and multiplies the total sample you need.
At a 10% baseline chasing a +20% lift, the calculator returns 3,839 visitors per variant. A listing pulling 2,000 unique visitors a day, split evenly, feeds 1,000 per variant per day, so the test runs about four days.
The calculator will not let every input move freely. Hold the lift you need and accept the duration, or hold the duration and accept whatever lift your traffic can detect. Choosing which one to fix is the actual decision, and it is the step skipped on the way to pressing calculate.
The field that wrecks the math is the baseline. Sellers plug in blended account conversion or ad-attributed orders because those numbers sit ready on the dashboard, and both inflate the rate. An inflated baseline makes the required sample look smaller, so you launch sooner, stop earlier, and read noise as a result.
An honest entry matters past the test itself. A verified lift on a listing compounds into a cheaper cost per sale on every PPC click and strengthens the signals behind organic rank, which is why an honest 3,839 beats a convenient guess.
Turning Sample Size Into Calendar Days
A sample target isn't a plan until it has an end date. Divide the per-variant target by the daily unique visitors you can route into each variant, and you get days.
Days to reach the planned sample by daily traffic per variant
| Daily visitors per variant | Days to 1,772 per variant | Days to 3,839 per variant | Days to 14,749 per variant |
|---|---|---|---|
| 250 | 8 | 16 | 59 |
| 500 | 4 | 8 | 30 |
| 1,000 | 2 | 4 | 15 |
| 2,500 | 1 | 2 | 6 |
| 5,000 | 1 | 1 | 3 |
| 10,000 | 1 | 1 | 2 |
Four adjustments before it goes in the calendar
- Round up to whole weeks. A 9-day test is really a 14-day test once weekday and weekend traffic split unevenly. Whole weeks keep both in the sample.
- Add 10 to 20% buffer. Tracking gaps, bot filtering, and days when a PPC budget cap throttles traffic to one variant all shave the sample you thought you had.
- Freeze everything else. A price change, a coupon launch, Prime Day or Q4 inside the window makes the result uninterpretable, not merely noisy.
- Set a ceiling in advance. If honest arithmetic needs more than six to eight weeks, the test is underpowered and a bigger structural change is the better use of the quarter.
Standard tools ask for baseline rate, minimum detectable effect, significance and power, with 95% confidence and 80% power as the usual recommendation, as Adobe's sample size guidance for A/B tests sets out. What they hand back is a number. Not a duration, not an opportunity cost, not the smallest effect your available traffic could ever detect.
The low-traffic case
A niche ASIN pulling 300 visitors a day cannot detect a 10% relative lift within any sensible window, and buying traffic to get there means paying for the experiment as well as the answer. Test a large change instead: a new hero image, a restructured title, a real price band move. Big swings need fewer visitors because the effect you're chasing is bigger.
Product pages that can't be tested at scale still get decided. They get decided by whoever changes the image first, which is a worse method than a pre/post comparison with its limitations written down openly.
The honest output of the calculator is one sentence: at this traffic, I can detect this much lift, in this many days, for this much ad spend. If any part of that sentence embarrasses you, don't run the test.
Deciding Whether the Result Is Real
Two numbers come out of the calculator after the test closes, and they answer different questions.
What the outputs actually mean
The p-value is the chance of seeing a difference this large if both versions performed identically. The confidence interval is the range of lifts still compatible with your data. The 5% convention isn't a law of nature. It traces to Ronald Fisher's The Design of Experiments in 1935, which popularized 0.05 as a practical threshold: under the null hypothesis, a p-value of 0.05 means results at least that extreme would occur about 5% of the time by chance, roughly results outside 1.96 standard deviations in a two-sided normal test, as the MacTutor biography of Fisher documents. Fisher's other contribution matters just as much here: random assignment, so device mix, geography and traffic quality don't systematically favor one version.
For the underlying mechanics, how to run proportion tests covers the two-proportion comparison a conversion calculator performs.
Reading a test result and choosing the next move
| What you see | What it means | What to do |
|---|---|---|
| p < 0.05 and the confidence interval sits above your minimum meaningful lift | Real and commercially worth it | Publish the winner and re-baseline |
| p < 0.05 but the interval's upper bound is below your minimum meaningful lift | Real effect, irrelevant size | Keep control and test a bigger change |
| Variant ahead on revenue but behind on units per visitor | Traffic mix or AOV shift, not a content win | Recheck allocation before deciding |
| p < 0.05 on day 4 of a 21-day plan | Peeking artifact | Wait for the fixed horizon |
Not every row deserves a debate. Significant and above your threshold means ship. Significant and below it means the effect is real and too small to bank, so you keep control and test something bolder.
Where Amazon reporting changes the answer
Manage Your Experiments splits listing visitors randomly and reports units per unique visitor, conversion rate, total units, sales and the probability that one version is better, per Amazon's Manage Your Experiments overview. The definitions matter: conversion rate is the share of unique visitors who saw a version and purchased, and units per unique visitor is units divided by visitors assigned to that version, as Amazon Seller Central's experiment reporting reference sets out. Results can be inconclusive or show low confidence even when one version has the higher observed number.
That's how a variant leads on revenue and trails on units per visitor. Revenue moves with traffic mix and average order value; units per visitor doesn't. When the two disagree, check allocation before you check the creative. And an early green number inside a fixed-horizon plan is a stopping artifact, not a finding, so it doesn't get a rollout.
If a variant does win, the next question is how much of that lift survives contact with the rest of the listing, which is where improving Amazon conversion rate stops being a single-image project.
Traps That Make a Clean Test Lie
The most expensive mistake in conversion testing isn't a bad hypothesis. It's stopping on the first good day.
Repeatedly checking results and stopping when significance appears invalidates the confidence level the calculator gave you. Checking after five equal batches can push the actual false-positive rate to about 14% against a nominal 5%, and twenty looks can take it toward 25%, as research presented at the ACM conference on knowledge discovery and data mining reports. The same work notes the conventional 0.05 alpha produces plenty of false positives when underlying experiment success rates are low, and proposes sequential group testing to reduce false discoveries while preserving power.
The traps and their one-line fixes
- Sample ratio mismatch. If the split lands 52/48, assignment is broken and the p-value is void no matter how good it looks. Fix it before you read anything else.
- Bundled changes. A new image plus a new title plus a price move tells you nothing about which one worked. One variable per test, or you've bought an anecdote.
- Judging on ACOS alone. A conversion win that lowers cost per order can look like a worse ACOS the moment you scale spend behind it. Watch contribution margin instead of the ratio.
- Segment fishing. Slice by device, then placement, then audience until something lands at p < 0.05 and you've manufactured a finding out of noise.
- Seasonality. A test straddling a demand spike measures the calendar, not the creative.
Each trap has a fix that fits on one line. Pre-register the horizon, or use a sequential test with adjusted stopping boundaries so you can check the dashboard without inflating the error rate. The sequential option is the honest route to faster decisions, and it costs you sample size to get it.
The discipline, in three lines: a fixed horizon, one variable at a time, and contribution margin as the scoreboard.
None of it holds if the numbers underneath are wrong, which is why improving data accuracy belongs in the test plan rather than in the post-mortem.
Run the Protocol on Your Listings
The method compresses into five steps, and every one of them happens before launch.
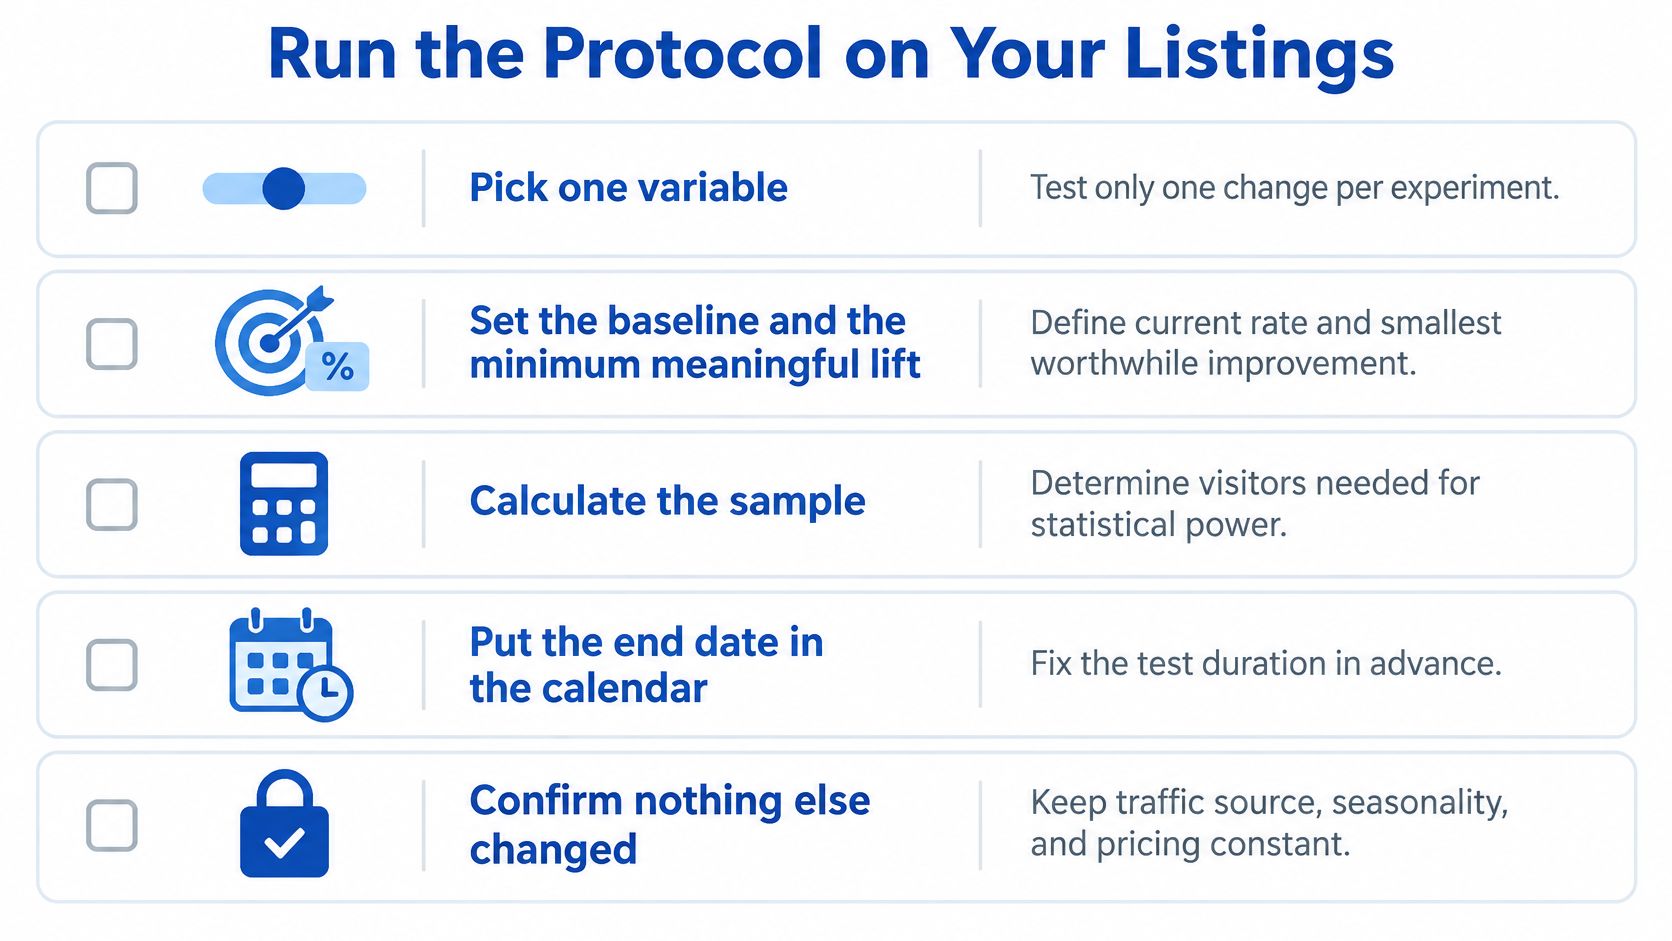
Pick one variable. Set the baseline and the minimum meaningful lift. Calculate the sample. Put the end date in the calendar. Confirm nothing else changed in the window. Then read the result against the threshold you committed to before the first visitor arrived. Every item on that list is a decision made in advance, which is the whole point of making it.
Here's the method walked through end to end for a listing test.
Why the win compounds
A detail page that converts better squeezes more orders from the same paid traffic. That lowers spend per order and supports the organic position your advertising is already buying. Amazon reports that sellers using Sponsored Products saw 34% more sales growth than sellers who did not, measured four weeks after adoption, according to Amazon's advertising overview. That figure doesn't prove a fixed PPC budget raises organic rank, and nobody should claim it does. It does mean listing conversion and ad efficiency get measured together, not in separate reports.
For the wider frame, conversion rate optimization for ecommerce covers how listing tests sit alongside pricing, traffic and merchandising decisions.
A test without a pre-committed threshold and a fixed end date is a guess with a dashboard.
One next step: request a free audit from Headline so the sample you plan matches the traffic your ASINs receive, rather than the traffic you'd like them to have.
Headline Marketing Agency runs Amazon PPC and DSP with the discipline this method demands: one variable at a time, a sample size agreed before launch, and contribution margin as the scoreboard instead of a vanity ACOS. We build A/B testing frameworks across listings, DSP creative and audiences, then tie every result back to cost per order and organic rank. If you'd rather plan tests around the traffic your ASINs have, visit Headline Marketing Agency and start the conversation.
Get Your Free Amazon PPC Audit
Discover untapped growth opportunities and see how our data-driven approach can improve your ROAS.
Get Free Audit →Wollen Sie Ihre Amazon PPC-Performance aufs nächste Level bringen?
Lassen Sie Ihre Amazon PPC-Kampagnen professionell analysieren und entdecken Sie neue Wachstumsmöglichkeiten.