Conversion Rate Optimization for Ecommerce in 2026
Conversion Rate Optimization for Ecommerce. A practical CRO playbook for ecommerce and Amazon brands. Learn to test listings, lift conversion rates, and turn

You've got traffic coming in, the ads are spending, and one product page is getting another round of creative feedback. Someone wants a new hero image; someone else wants a bigger coupon. But if nobody can show where shoppers drop off, whether the traffic is qualified, or what happens to margin after a change, that's not a CRO program. It's a series of guesses.
Conversion rate optimization for ecommerce should help you turn existing demand into profitable orders, then use what you learn to make paid and organic growth more efficient. For an Amazon brand, that means judging tests by more than conversion rate alone. A page that converts better but relies on a margin-draining promotion may not be a win. A page that helps paid traffic convert and strengthens organic sales can be.
What Conversion Rate Optimization Really Means in 2026
A redesign can make a page look different. It can't tell you whether the change made shoppers more likely to buy profitably. CRO is the discipline of finding friction, prioritizing the fixes that matter, and measuring what shoppers do next.
The distinction matters because one blended conversion rate hides different problems. A shopper can click an ad, view a product, add it to a cart, begin checkout, and still leave. Each stage has a different failure mode, and each needs a different response. Baymard Institute's 2025 checkout research reports that approximately 70% of ecommerce users abandon after adding products to their cart, meaning about 30% of sessions that reach the cart stage proceed to an order. That's an aggregate benchmark, not a universal rate, but it makes the point: getting shoppers to a product page is only part of the job. Baymard's checkout research shows why checkout usability and cost transparency belong in the conversion conversation.
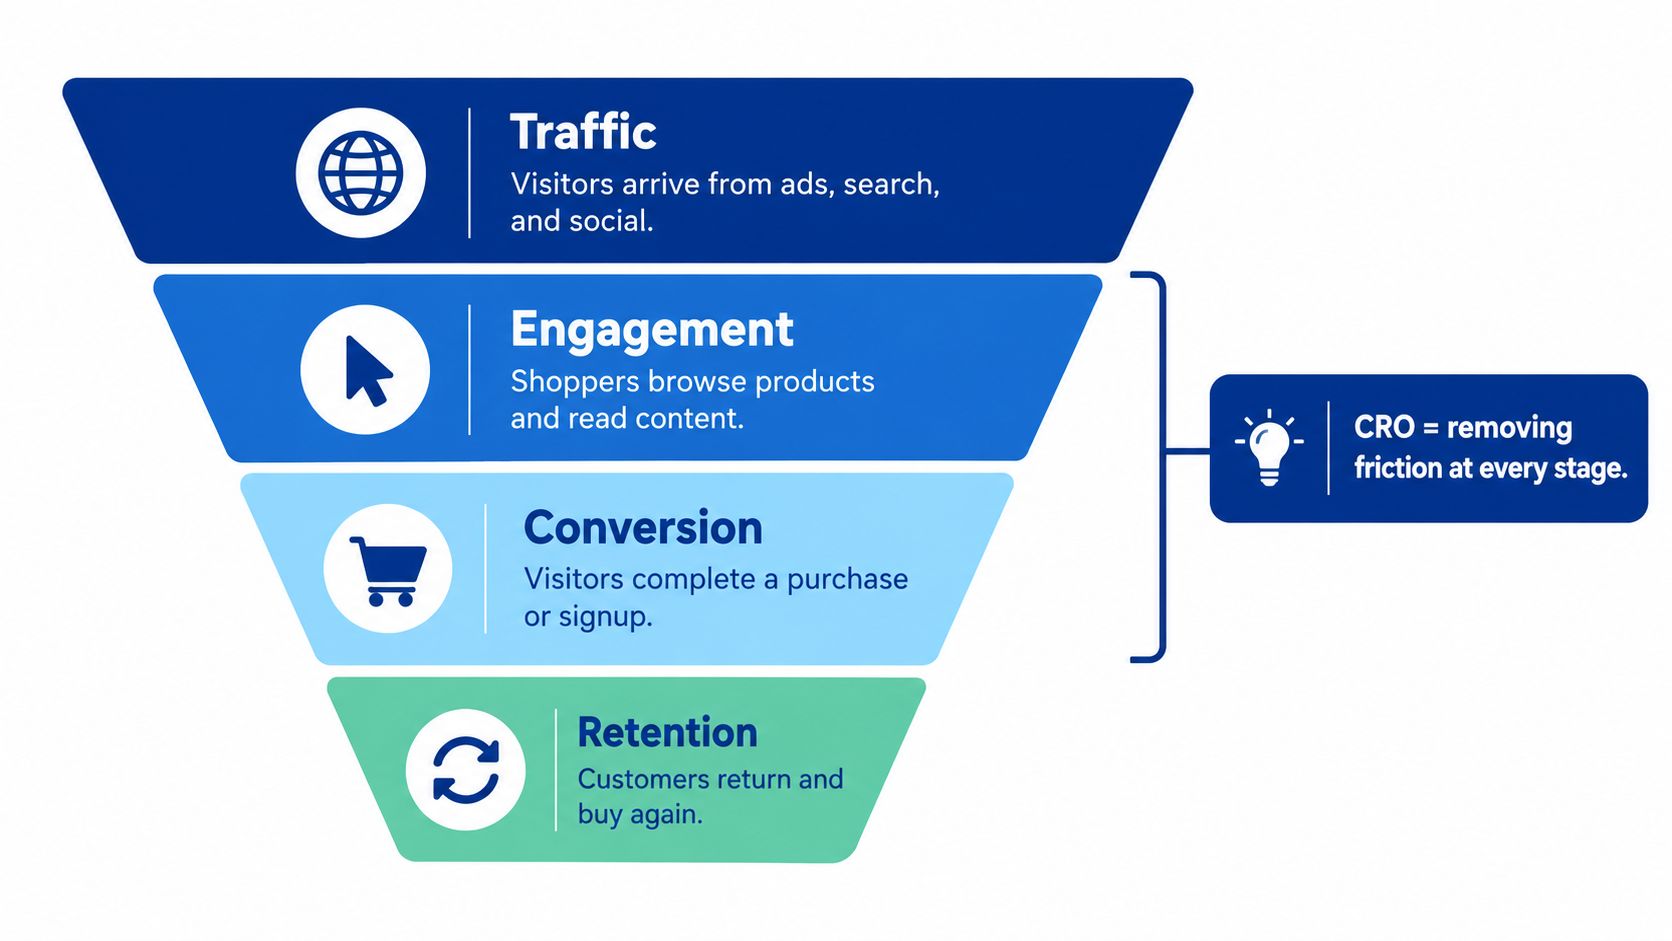
Measure the stages, not just the finish line
On Amazon, you won't control every checkout detail. You can still influence what happens before checkout: whether the title matches the search, whether the image communicates the product clearly, whether pricing feels credible, and whether the listing answers the shopper's questions. On a DTC site, you have more control over checkout, but the same rule applies. Diagnose the stage that leaks before changing the page.
That also means a small improvement on a high-traffic ASIN can matter more than a dramatic percentage lift on a product with little traffic. Prioritize by commercial impact, not the visual size of the change. The right test is one that improves the economics of meaningful traffic without damaging order value or customer quality.
If your team needs a plain-language foundation for the discipline, this conversion rate optimization guide from YipSMS Inc. offers a useful framing. Treat CRO as the operating system under your PPC and DTC growth, not as a side project for the design team.
The Metrics That Actually Drive CRO Decisions
A conversion rate without context is an incomplete answer. A low rate might reflect weak traffic, a confusing product page, or friction at checkout. A high rate might still produce poor economics if the orders depend on discounts or come from low-margin products.
Build a scorecard that follows shopper intent from discovery to purchase. Keep the view segmented by device, acquisition source, and product, then compare the stages rather than relying on one sitewide average.
Read the funnel as a sequence
Start with click-through rate (CTR). It tells you whether the ad or search result earns attention, not whether the click was valuable. Then examine product-page conversion rate, add-to-cart rate, checkout completion, and revenue per visitor (RPV). Together, these show whether the promise attracts the right shopper and whether the listing or site delivers enough confidence to close the sale.
Separate branded and non-branded traffic. Brand-aware shoppers arrive with different intent from people discovering the product through a generic category query. On Amazon, use Search Query Performance and Amazon Marketing Cloud signals alongside campaign data to understand how query behavior, ad exposure, and sales relate. Don't treat an aggregate result as a verdict on every audience.
A practical scorecard can fit on one page:
- Traffic quality: CTR and source, split by branded versus non-branded intent.
- Product engagement: product-page conversion and add-to-cart rate by device and ASIN.
- Checkout health: checkout starts compared with completed orders, segmented by device.
- Commercial outcome: RPV and contribution margin per visitor, with promotion and media costs accounted for.
Google's retail analysis found that a 0.1-second improvement in mobile load time was associated with an 8.4% increase in retail conversions and a 9.2% increase in average order value. Those are correlations, not guarantees, but they're a strong reason to include speed in the scorecard. Google's Mobile Site Speed Playbook covers the commercial relevance of mobile performance.
Make disagreement useful
If CTR rises while conversion falls, don't argue from preference. Check whether the new ad attracted a broader, less qualified audience or whether the landing experience failed to match the promise. If conversion rises while contribution margin falls, the test may have bought orders at the expense of profit.
Decision rule: When two metrics disagree, segment the result and write a new hypothesis. Don't pick whichever number supports the change you already wanted.
Building a Hypothesis Backlog Worth Testing
The loudest stakeholder shouldn't set your testing roadmap. A good backlog starts with evidence of friction, then translates that evidence into a testable claim. Use customer reviews, search-term reports, support tickets, and DTC session evidence to identify what shoppers don't understand or can't complete.
Baymard's checkout work combines 272 moderated usability sessions, eye-tracking, more than 850 benchmarked checkout steps, and nine quantitative studies involving 11,777 participants. The lesson for operators isn't to copy a design pattern blindly. It's to diagnose the problem before changing the interface. Baymard's checkout usability research illustrates why qualitative observation can help explain the behavior behind the numbers.

Turn observations into experiments
Write each idea in a format that makes it falsifiable: “If we change X for audience Y, metric Z should improve, while guardrail W stays healthy.” For example, if mobile shoppers struggle to understand a product's size or use from the current main image, test a clearer mobile-first image against the existing version. Don't bundle that with a desktop layout overhaul. If several elements change at once, you won't know which one drove the result.
For a DTC store, the same method might start with session replays showing that mobile shoppers hesitate around shipping information. Test clearer delivery-cost messaging against the current presentation, and measure completed orders alongside contribution margin and refund rate. The point isn't to assume the change will win. It's to put a specific explanation to the test.
Score ideas on impact, confidence, and ease. Impact asks how much of the business the friction could affect. Confidence measures how strong the supporting evidence is. Ease accounts for the work required to test and implement the change. A high-impact issue seen repeatedly in customer feedback deserves attention before a low-confidence aesthetic preference.
| Backlog field | What to record |
|---|---|
| Evidence | The review, query, support issue, or observed behavior |
| Hypothesis | The change, audience, expected outcome, and guardrail |
| Priority | Impact, confidence, and implementation effort |
| Decision rule | What result would make you keep, reject, or revise the change |
Keep the backlog focused. Several well-supported experiments beat a long queue of speculative redesigns. Reserve most testing capacity for a few high-impact problems, and do not call an idea “validated” until the defined metric and guardrails support it.
Designing Tests on Amazon and on Your DTC Store
Amazon and DTC testing share the same discipline, but they don't give you the same controls. Amazon's Manage Your Experiments tool compares eligible detail-page content within the marketplace. A DTC testing platform can offer broader control over page layouts and experiences, while leaving your team responsible for the implementation and measurement setup.
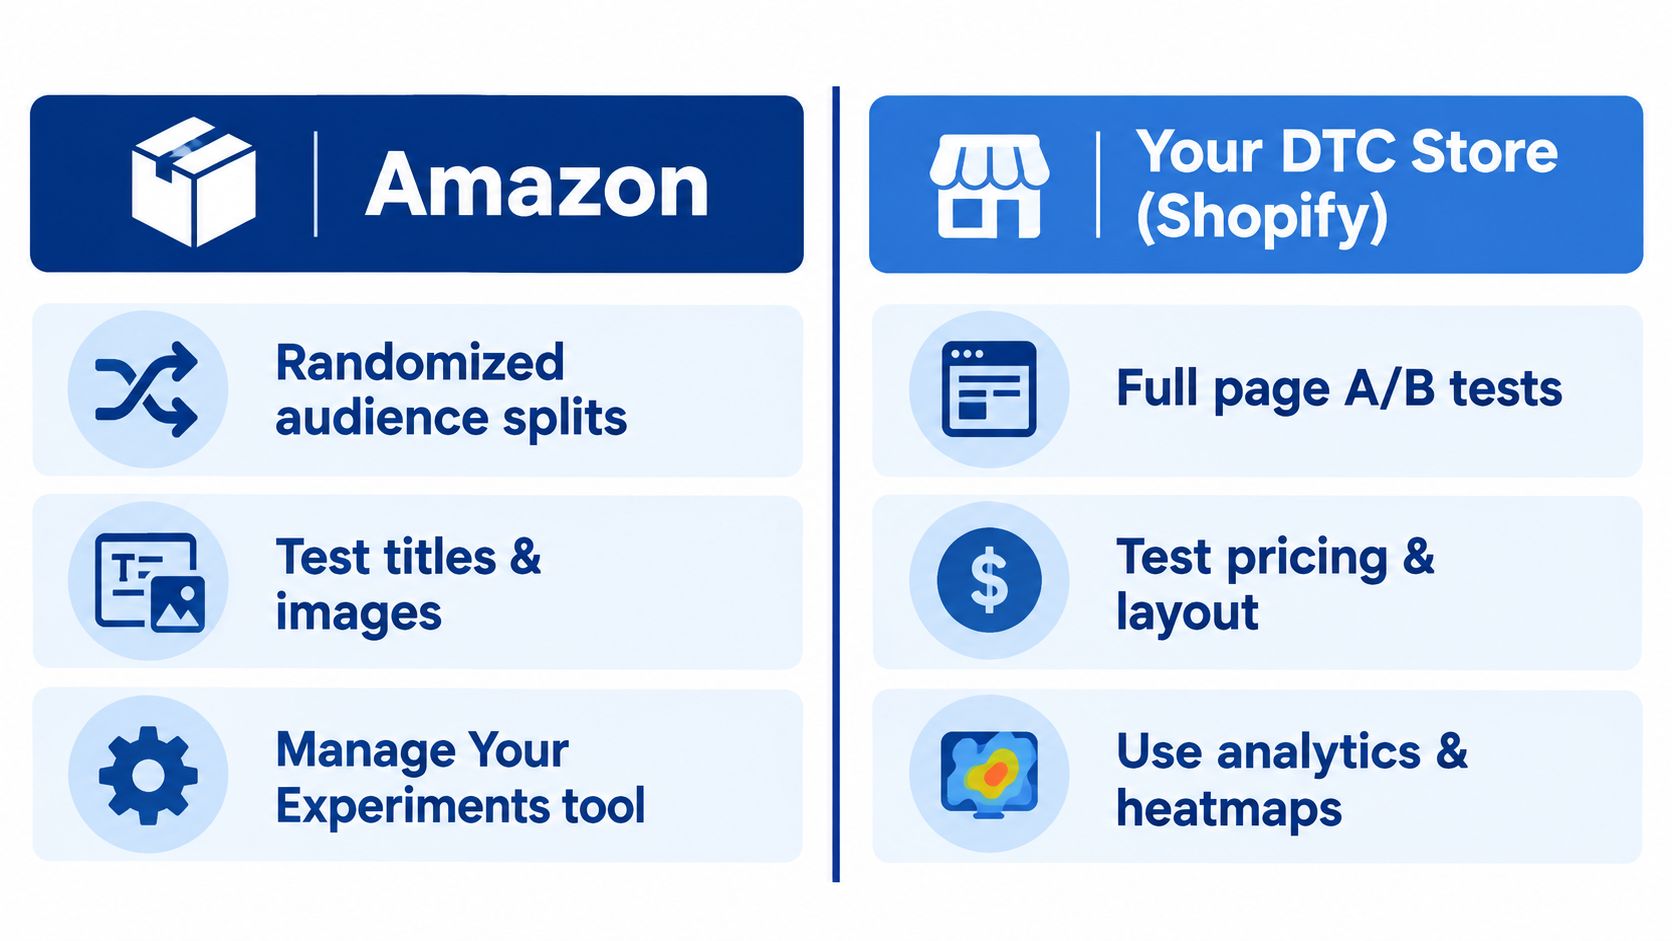
Amazon's Manage Your Experiments tool uses randomized audience splitting for eligible product detail pages. Brands can test titles, main images, bullet points, descriptions, and A+ Content. Results include units sold, sales, conversion rate, units sold per unique visitor, and sample size. Amazon also offers an “Experiment to Significance” option, with documentation describing a 66% or better significance level. See Amazon's explanation of Manage Your Experiments for the tool's reporting and experiment options.
Match the method to the surface
On Amazon, define the decision before launch: should the new main image replace the current one, or should the existing title remain? Judge the test by the outcome that matters to the business, not by a temporary change in advertising cost of sales. If the sample is weak or the result is inconclusive, keep the control and gather more evidence instead of manufacturing a winner.
For DTC, a classic A/B test can include page elements Amazon doesn't expose to sellers in the same way, such as broader layout or pricing presentation. That flexibility comes with responsibility. Set the primary metric, guardrails, baseline, minimum detectable effect, confidence threshold, and sample requirements before exposing visitors to variants. Don't stop because the dashboard looks promising early.
| Dimension | Amazon Manage Your Experiments | Classic DTC A/B Test |
|---|---|---|
| Traffic allocation | Randomized split within eligible Amazon traffic | Set up and managed through the testing platform |
| Typical test surface | Titles, images, bullets, descriptions, A+ Content | Landing-page layouts, price presentation, and page elements |
| Reporting | Sales, units sold, conversion, units per visitor, sample size | Depends on analytics and experiment configuration |
| Main constraint | Limited to eligible marketplace content | Requires reliable implementation and measurement |
| Decision discipline | Use the experiment result, not short-term ad swings | Follow pre-set sample and decision rules |
If you're planning to test Amazon listing content, make sure your operating setup supports the work; this overview of the Amazon Professional selling plan provides relevant account context.
Which Levers Produce the Conversion Lift
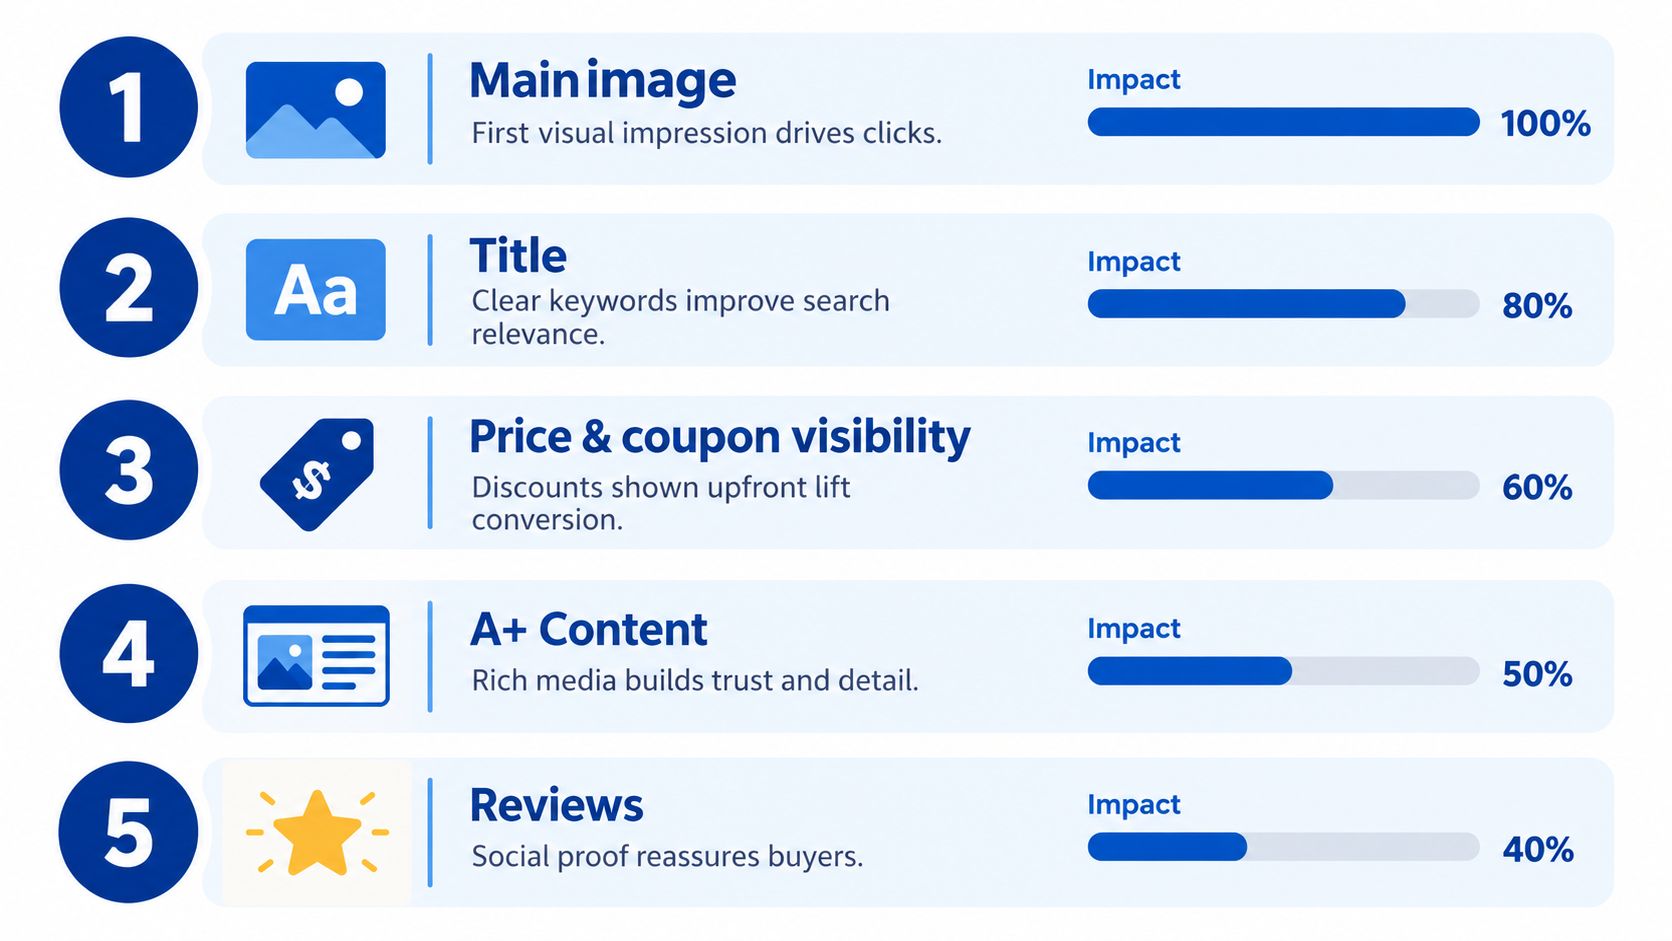
A shopper deciding between two similar products needs clear reasons to choose yours. On Amazon, start with the main image, title, pricing clarity, coupon visibility, A+ Content, reviews, variation choices, delivery expectations, and mobile readability. Let the friction your data shows set the priority order. Judge each change by its effect on contribution margin and organic rank, as well as conversion rate.
Remove uncertainty before you add incentives
A discount can prompt a purchase, but it can also erode margin while leaving the reason for hesitation untouched. Baymard reports that 39% of shoppers abandon because extra costs such as shipping, taxes, or fees appear late; 12% can't see or calculate the total upfront; and 18% abandon because account creation is required. Baymard's cart-abandonment findings support a practical alternative to reflexive discounting: show the full cost and purchase conditions earlier.
Amazon sellers don't control every checkout element, yet they can clarify key signals before checkout. Make variation pricing easy to understand, state the offer and delivery expectations clearly, and use coupons deliberately. Compare incremental sales against the effect on contribution margin. Before changing price, review the business implications of Amazon's dynamic pricing approach.
When fit or sizing creates doubt, give shoppers visual guidance. Teams can compare fit with Robosize's visualizer to consider how clearer product comparisons may reduce uncertainty on a product page.
Put the next effort where it can pay back
A clearer main image helps shoppers understand the product before clicking. A precise title aligns search intent with the offer. A+ Content can answer questions that images and bullets leave unresolved, while credible reviews and visible ratings reinforce trust. Assess each change against the page's audience and its commercial contribution.
Mobile speed deserves focused attention on DTC stores. For Amazon listings, prioritize mobile readability and image clarity. Review device performance separately, then focus on the two or three frictions affecting the most valuable traffic. Keep changes that improve contribution margin and support organic rank, not just those that raise conversion rate. A device-specific review will show whether mobile shoppers need faster pages, clearer product details, or both.
Why PPC and CRO Are the Same Growth Loop
Paid media and CRO shouldn't live in separate reporting decks. PPC brings shoppers to a listing or landing page; CRO determines whether that traffic becomes an economically sound order. If the page underperforms, scaling spend just buys more visits to the same bottleneck. If the page improves, the same advertising effort can produce more value, while a stronger retail experience can support organic demand.
Amazon says sellers using Sponsored Products saw 34% more sales growth on average than sellers that didn't, measured four weeks after adoption. That's an average association, not a promise that every ad dollar is incremental. Amazon's Sponsored Products information supports treating PPC as a demand and discovery lever, while still measuring profitability rather than assuming all attributed sales are caused by ads.
Align the ad promise with the detail page
Amazon Ads reports a concrete example with Skin Grip: video creative delivered 3.7 times higher click-through rate and 15% higher conversion across Sponsored Products video, Sponsored Brands video, and Amazon DSP. The Skin Grip case study illustrates a point that matters across campaigns: a compelling ad is not enough if the detail page doesn't continue the same story.
Use ad creative to attract the shopper your product can serve, then make the listing substantiate the promise. Measure CTR with conversion, cost per order, contribution margin, and organic sales signals. If clicks rise but conversion doesn't, investigate traffic quality and message mismatch before increasing bids.
Scaling PPC without improving the destination is an expensive way to discover that the listing was the constraint.
This is also why CRO results should inform media decisions. A test that improves conversion on a meaningful paid audience can change which ASINs, queries, or creative deserve more budget. But don't claim organic rank lift from a conversion test unless your own marketplace data supports that conclusion. Track organic visibility and sales alongside paid performance, and distinguish observed movement from proven causality.
Headline Marketing Agency combines Amazon PPC and DSP management with product-detail-page testing across titles, imagery, bullet points, and A+ Content. The useful operating principle is the same whether you manage the work in-house or with an agency: connect traffic acquisition, merchandising, and profitability in one decision loop.
Your 90-Day CRO Operating Plan
Give the team a cadence, not a vague mandate to “optimize conversion.” Make every experiment answer a business question, and set a stop rule before launch so a disappointing result produces learning rather than endless tinkering.
Weeks 1–2: Build the baseline
Instrument the funnel by device, traffic source, landing page, and product. Create the scorecard, verify that the metrics are reliable, and freeze the key page elements you'll use as controls. If tracking is inconsistent, fix that before testing.
Weeks 3–6: Run focused experiments
Launch the first Amazon experiments on ASINs receiving meaningful paid traffic, alongside a DTC landing-page test if you have a store. Write down the primary metric, guardrails, and decision rule in advance. Kill or revise a test if tracking breaks, the variant changes beyond the intended scope, or the evidence doesn't support the hypothesis. Don't stop early just because a short-term result looks favorable.
Weeks 7–10: Apply the evidence
Roll out supported winners, retain controls where results are inconclusive, and direct PPC toward products and queries with sound economics. Build the next backlog from observed friction and the results of the first tests. Don't increase spend solely because conversion improved; confirm margin and inventory can support the move.
Weeks 11–13: Make wins durable
Turn validated changes into evergreen listing content and aligned ad creative. Document losses as well as wins, then write the next quarter's backlog. Amazon's reported Sponsored Products sales-growth association is a reason to consider paid traffic as part of the learning engine, not a guarantee of profitable growth. Keep scale decisions tied to contribution margin and measured outcomes.
The takeaway is simple: use PPC to bring the right shoppers, CRO to reduce friction, and profitability to decide what scales. Review that loop with your retail, media, and merchandising teams on a regular cadence.
Headline Marketing Agency helps consumer brands connect Amazon PPC and DSP with data-led product-page testing, with a focus on profitability, organic growth, and sustainable scale. If you want a partner to align campaign management with CRO experiments and marketplace performance, visit Headline Marketing Agency.
Get Your Free Amazon PPC Audit
Discover untapped growth opportunities and see how our data-driven approach can improve your ROAS.
Get Free Audit →Ready to Transform Your Amazon PPC Performance?
Get a comprehensive audit of your Amazon PPC campaigns and discover untapped growth opportunities.