New to Brand Metrics Amazon: How to Read NTB Data
New to Brand Metrics Amazon explained: measure first-time buyers and set smarter PPC budgets.

The monthly Amazon review lands and there's a tab you keep skipping. Next to spend, clicks and ACOS sits a block of columns labelled new-to-brand orders, new-to-brand sales, percentage of orders new-to-brand, and new-to-brand detail page views. The numbers look fine. Then someone asks whether that means you're growing the customer base or selling to the same people again, and the room goes quiet.
That silence costs money. New to brand metrics on Amazon are the only built-in way to tell whether advertising is buying growth or harvesting demand you already own. They're also the easiest numbers in the account to misread. A high NTB share can sit on top of a campaign that loses money on every first order. A low one can hide a campaign that recruits households your competitors used to own.
Here's how I read those columns, where they lie to you, and how to turn them into a budget decision instead of a slide.
New-to-Brand Metrics at a Glance
Six metrics show different points in the path from product-page interest to purchase. Read them as diagnostic measures, not as a single score of acquisition quality.
| Metric | What It Counts | Lookback Window | How to Read It |
|---|---|---|---|
| NTB purchases | First-time purchases of the brand's products | 12 months | Count of purchases classified as new-to-brand |
| NTB sales | Sales value attached to those purchases | 12 months | Revenue from purchases classified as new-to-brand |
| NTB purchase percentage | NTB purchases divided by total purchases | 12 months | Share of purchases classified as new-to-brand |
| NTB detail-page views | First-time product-page views | 12 months | Early product interest from shoppers classified as new-to-brand |
| NTB add-to-carts | Add-to-cart actions by shoppers classified as new-to-brand | Same 12-month brand history as purchases | Consideration before purchase |
| NTB branded searches | Brand searches by shoppers classified as new-to-brand | Same 12-month brand history as purchases | Search activity associated with new-to-brand shoppers |
Amazon Ads reports NTB purchases, their associated sales, and NTB detail-page views using a one-year lookback across purchase and browsing history (Amazon Ads NTB documentation). NTB purchase percentage puts the purchase count in context by dividing it by total purchases. It can show whether a campaign's orders skew toward new shoppers, but it does not show whether acquiring them was profitable.
Availability varies by campaign type and report. Check the columns in the relevant campaign table before comparing results across formats. For teams assessing whether an analytics provider can make Amazon data usable in reporting, AI vendor evaluation for online retailers covers data access and reporting depth.
The action for this week: Pull NTB purchase percentage and NTB sales for your three highest-spend campaigns. Compare the new-to-brand sales with the cost of generating them, then use contribution margin to judge whether the acquisition supports more budget. A high NTB share alone is not a reason to spend more.
How the 12-Month Lookback Classifies Shoppers and Where It Misleads
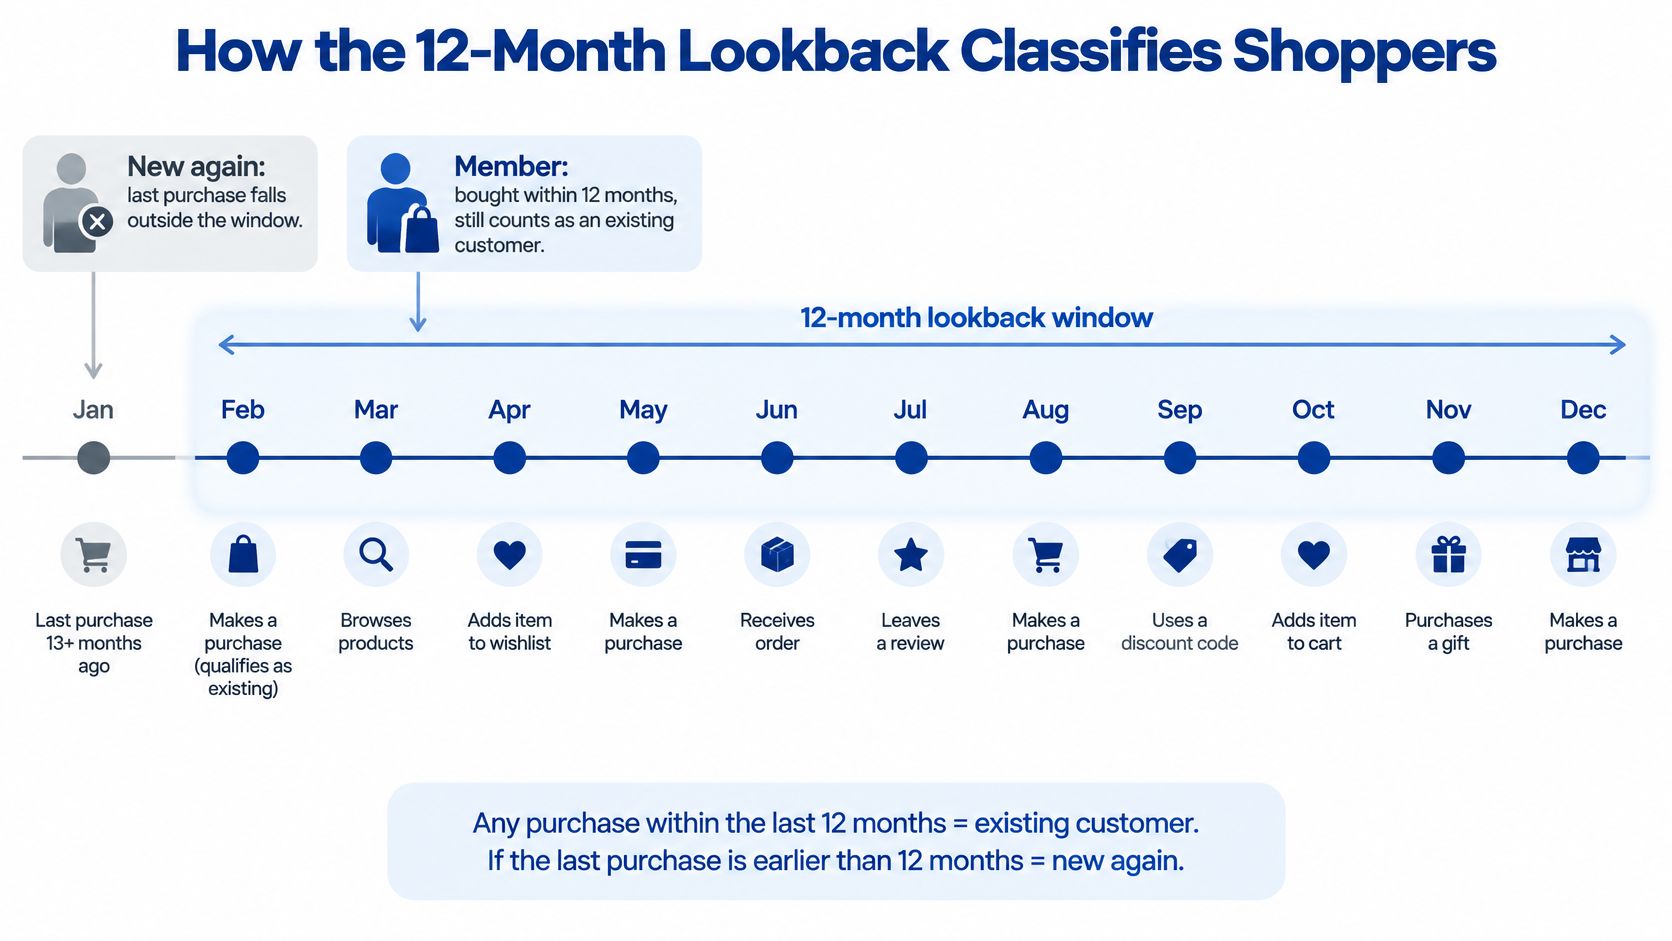
Think of it as a membership year. A shopper who bought from your brand on Amazon at any point in the last twelve months is still a member. A shopper whose last purchase falls outside that window has let the membership lapse, and their next order counts as new again.
Amazon's classification follows exactly that logic. A purchase qualifies as new-to-brand when the shopper had not purchased from the brand during the preceding 12 months, and the test uses the customer's broader purchase history across the brand rather than only orders previously attributed to advertising, as Amazon's NTB documentation sets out. That's an often-overlooked detail. Say a shopper bought a cleanser from you last spring and now clicks a Sponsored Brands ad for your moisturiser. The order is attributed to the ad. It still isn't NTB, because the brand purchase sits inside the window.
What the rule counts, and what it ignores
NTB purchases, the NTB percentage and NTB sales all read from the same brand-level history, so the three stay consistent with each other. What they don't see is anything off Amazon. A customer who buys from your own site, your retail partners or your physical stores every month can still arrive on Amazon and register as new to brand, which makes the metric best read as new-to-brand-on-Amazon rather than total customer acquisition (Amazon Ads NTB guidance).
That cuts both ways in a review. It means NTB overstates acquisition for brands with a strong direct business, and understates it for brands whose off-Amazon demand is small. Neither error is visible in the report.
Practical rule: NTB tells you who is new to Amazon's view of your brand, not who is new to your company.
Four misreadings and the checks that correct them
NTB as total acquisition. Reconcile NTB buyers against first-party CRM records before you celebrate. Match on email where you can, then ask how many of those buyers existed in your database a year ago.
Overvaluing campaigns that move existing customers onto Amazon. Read Amazon Marketing Cloud paths for the cohorts you suspect, and check whether the shopper saw brand content elsewhere first. A campaign shifting loyal direct customers into the marketplace looks like acquisition and behaves like channel migration.
Undervaluing campaigns that recruit new households. These often post fewer immediate attributed orders. Track NTB cohort repeat rates over the following months rather than judging on month one.
Judging the whole programme on ACOS alone. Run a holdout incrementality test on the campaign you're least sure about. Suppress a slice of the audience and watch whether new-buyer orders fall or just move.
One quarterly check catches most of this: compare NTB sales with attributed sales for the same period. The gap is spend on shoppers you already had.
If NTB share climbs while repeat rates and margin slide, the campaign is recruiting people you can't keep profitably. Watch for campaigns that deliberately target lapsed buyers. They post strong NTB numbers because of how the window works, and those numbers say nothing about whether you won a household.
Reading the NTB Funnel From Browse to Buy
Stage data is where NTB stops being an acquisition badge and starts being a diagnostic. Amazon reports NTB outcomes across branded searches, detail-page views, add-to-carts and purchases, which gives you a measurable path from first exposure to first order and a clear place to look when growth stalls (Amazon Ads NTB funnel metrics).
| Funnel Signal | Likely Cause | Where to Act |
|---|---|---|
| Strong NTB detail-page views, weak NTB add-to-carts | Listing, offer or creative problem | Listing images, offer and ad creative |
| Strong NTB add-to-carts, weak NTB purchases | Price, reviews, fulfillment or conversion friction | Pricing, review content and delivery promise |
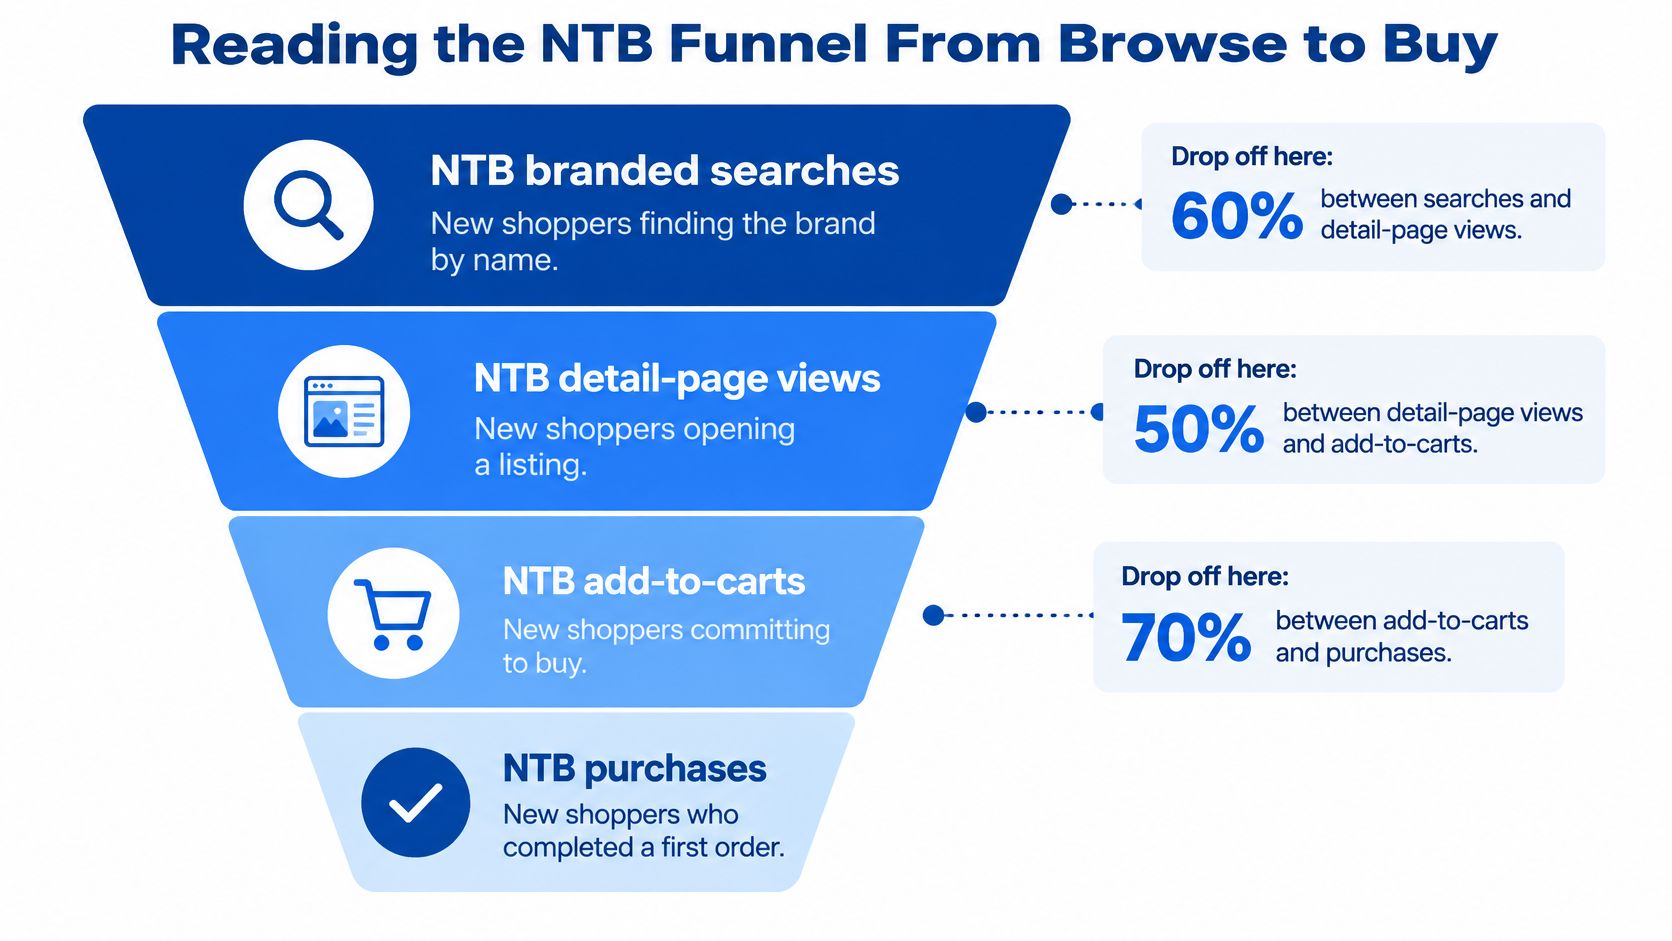
The first pattern is a first-impression problem. New shoppers are opening the listing, and something between the hero image and the offer fails to convince them. I'd start with the cheapest fix, which is usually the main image and the first three bullets, then test the ad creative that set the expectation.
The second pattern is a trust or friction problem. People want the product and something stops the checkout: price against the comparison set, review depth, delivery estimate or a page that makes the decision harder than it needs to be.
Read stage-to-stage rates over a rolling 30 days, not raw counts. Raw NTB detail-page views rise whenever you add spend, so they tell you nothing on their own. Convert each stage into a ratio of the stage before it, and you can see whether a bigger budget is buying depth or just attention.
A new shopper who stops at the detail page isn't a failed acquisition. It's a stage you can name and fix.
The budget consequence is direct: money follows campaigns that move new shoppers deeper, not campaigns that produce views. When you're weighing whether more top-of-funnel reach belongs in next quarter's plan, incremental reach measurement in Amazon DSP explains how to test whether extra reach adds buyers.
There's an organic payoff too. NTB conversion data tells you which listing elements persuade first-time shoppers, and first-time conversion is what feeds organic ranking. Fix the weakest stage before you raise a single bid.
Benchmarks That Tell You When to Spend More
Amazon publishes an NTB benchmark that compares your brand with others using ad-spend-weighted calculations, and it keeps monthly benchmark data available for up to 13 months, with recommended actions that connect NTB performance straight to budget allocation (Amazon's NTB benchmark guidance). Thirteen months is the useful part. It lets you put this October next to last October instead of next to a seasonally distorted September.
| NTB Share vs Benchmark | Amazon Recommendation | Budget Move |
|---|---|---|
| Above benchmark | Increase prospecting and expand to similar new-customer segments | Scale prospecting only while cost per NTB purchase stays under first-order margin |
| Below benchmark | Balance prospecting and retargeting and refine acquisition | Hold prospecting spend steady while fixing targeting and creative, then review the retargeting share |
The benchmark tells you which direction to move. It doesn't tell you how far, because it knows nothing about your margin. That's the second gate, and it's the one that often gets skipped.
The margin check that sets the ceiling
Divide prospecting spend by NTB purchases to get your cost per NTB purchase. Compare it with the contribution margin on a first order. Under the margin, you can scale in small steps and widen targeting, then watch whether the cost holds as the audience gets less precise. Over the margin, the first order loses money and the cohort has to repay it through repeat purchases.
The test: if cost per NTB purchase sits above first-order margin and repeat rates don't close the gap, you're buying customers you can't afford to keep.
If you need an external reference point for what a first order is allowed to cost, CAC benchmarks for BigCommerce stores breaks customer acquisition cost down by channel and scale, which helps you sanity-check the margin floor you're defending on Amazon. Our approach at Headline focuses on contribution margin optimization and profit-based bidding rather than ACOS alone, and that distinction earns its keep. For the efficiency side of the same review, our Amazon PPC benchmarks for 2025 give you ACOS ranges to read alongside NTB share.
The action: calculate your NTB share and cost per NTB purchase for every month the benchmark covers, then mark each one above or below. The pattern across months is the signal. One month is noise.
A Worked Example of NTB in a Monthly Review
Two campaigns, one month, illustrative numbers. Campaign A runs 400 orders with 120 of them NTB, an NTB share of 30%. Campaign B runs 300 orders with 240 of them NTB, an 80% share.
| Campaign | Orders | NTB Share |
|---|---|---|
| Campaign A | 400 | 30% |
| Campaign B | 300 | 80% |
A manager skims this and picks Campaign B as the acquisition engine. Fair instinct, incomplete decision. Campaign B still has to pass the margin gate, and the review needs to know whether its spend pulls in shoppers who would have bought anyway.
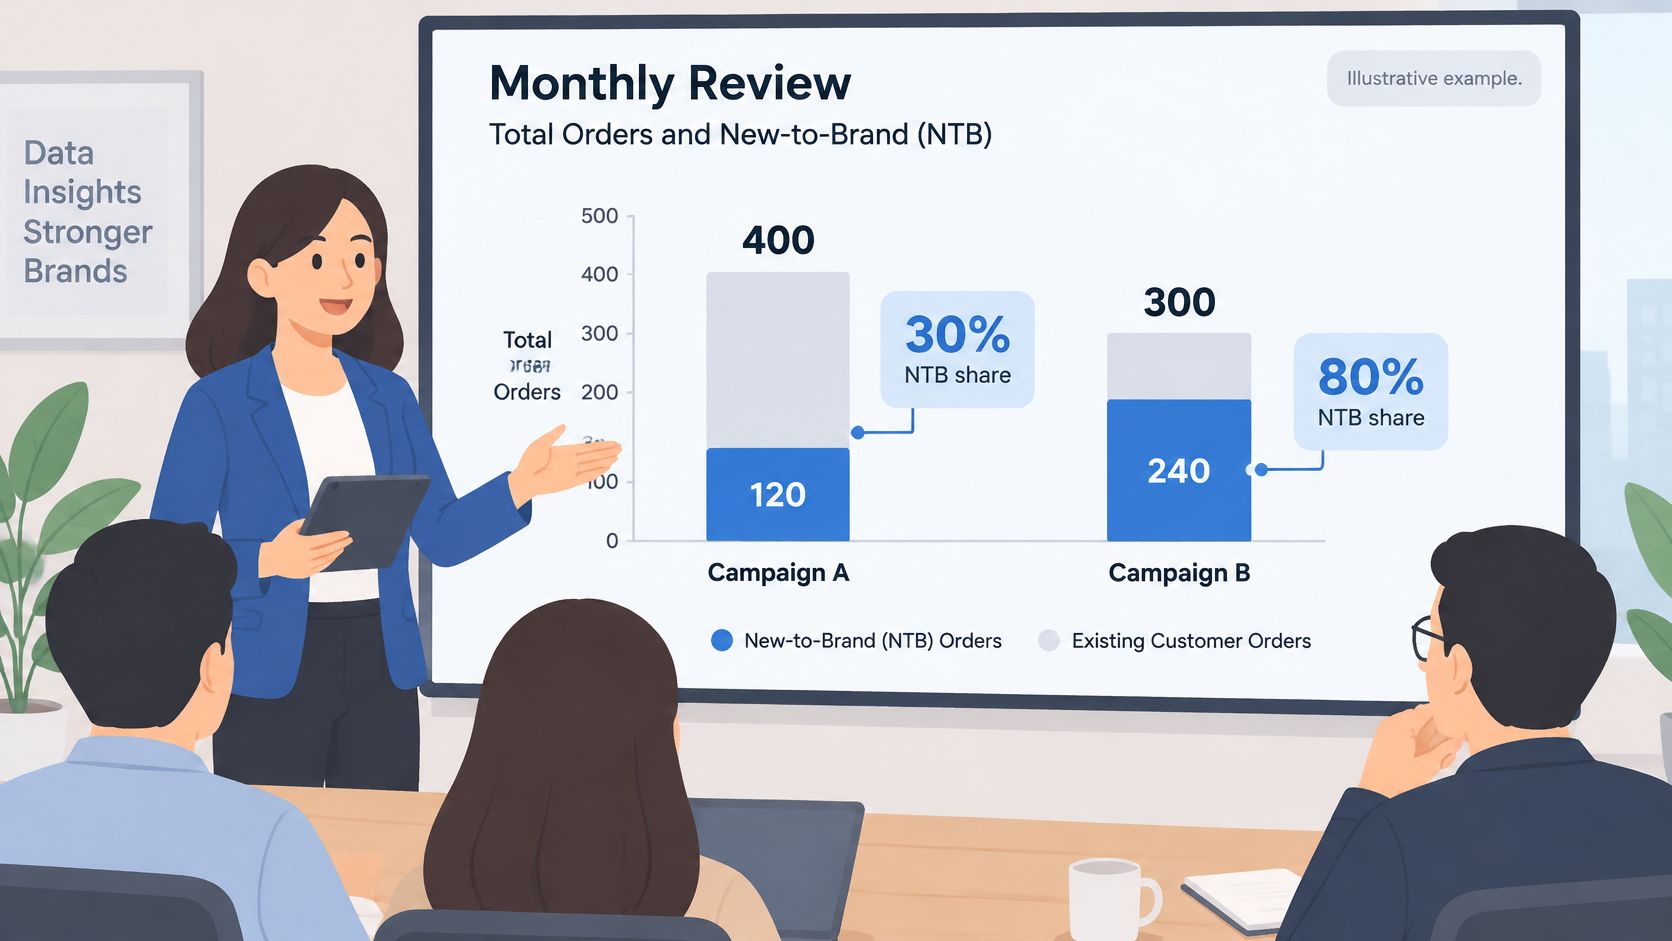
If Campaign B's cost per NTB purchase lands under first-order margin, scale it in small steps and watch the number hold as targeting widens. If it lands above, hold spend where it is and fix the leaking stage using the stage-to-stage rates from the funnel review. A campaign with an 80% NTB share and a broken add-to-cart rate is a conversion problem wearing an acquisition costume.
How the decision changes with cost per NTB purchase
Once you add cost per NTB purchase and NTB sales per campaign, the picture inverts quickly. Campaign A can carry a low NTB share and still be the more profitable line if it converts efficiently and its buyers repeat. Campaign B can be the growth engine or an expensive habit, and only the cost figure separates the two.
Watch the trend, not the snapshot. One month of NTB data proves almost nothing. The method works because you log the same three numbers every month and let the direction of travel argue for you.
This is what the numbers look like when the machinery works. On Headline's Amazon DSP work, the reported results include +84% New-to-Brand Sales, +127% Brand Awareness, 3.8x ROAS, and +52% Market Share, which is the kind of movement you only see when prospecting is scaled against a margin gate rather than a share target.
A monthly NTB review that doesn't reconcile to a reporting framework drifts within a quarter. Our data-driven Amazon PPC reporting framework shows the table structure I use, so the NTB share, NTB sales and cost per NTB purchase sit in the same row as spend and margin.
The action: rebuild last month's review table with NTB share, NTB sales and cost per NTB purchase for every campaign. Sort by cost per NTB purchase, not by share.
Set Your NTB Targets Before the Next Budget Review
Here's the sequence I'd run before anyone approves a budget change.
- Pull every month of history the benchmark exposes for NTB purchase percentage, NTB sales and cost per NTB purchase, campaign by campaign.
- Mark each month above or below benchmark and note the direction of travel across the set, not just the latest figure.
- Set a prospecting spend ceiling at the point where cost per NTB purchase meets first-order contribution margin.
- Calculate stage-to-stage rates across the NTB funnel and fix the weakest stage before adding budget anywhere.
- Reconcile NTB buyers with CRM records and book one holdout test before you scale a campaign past its current ceiling.
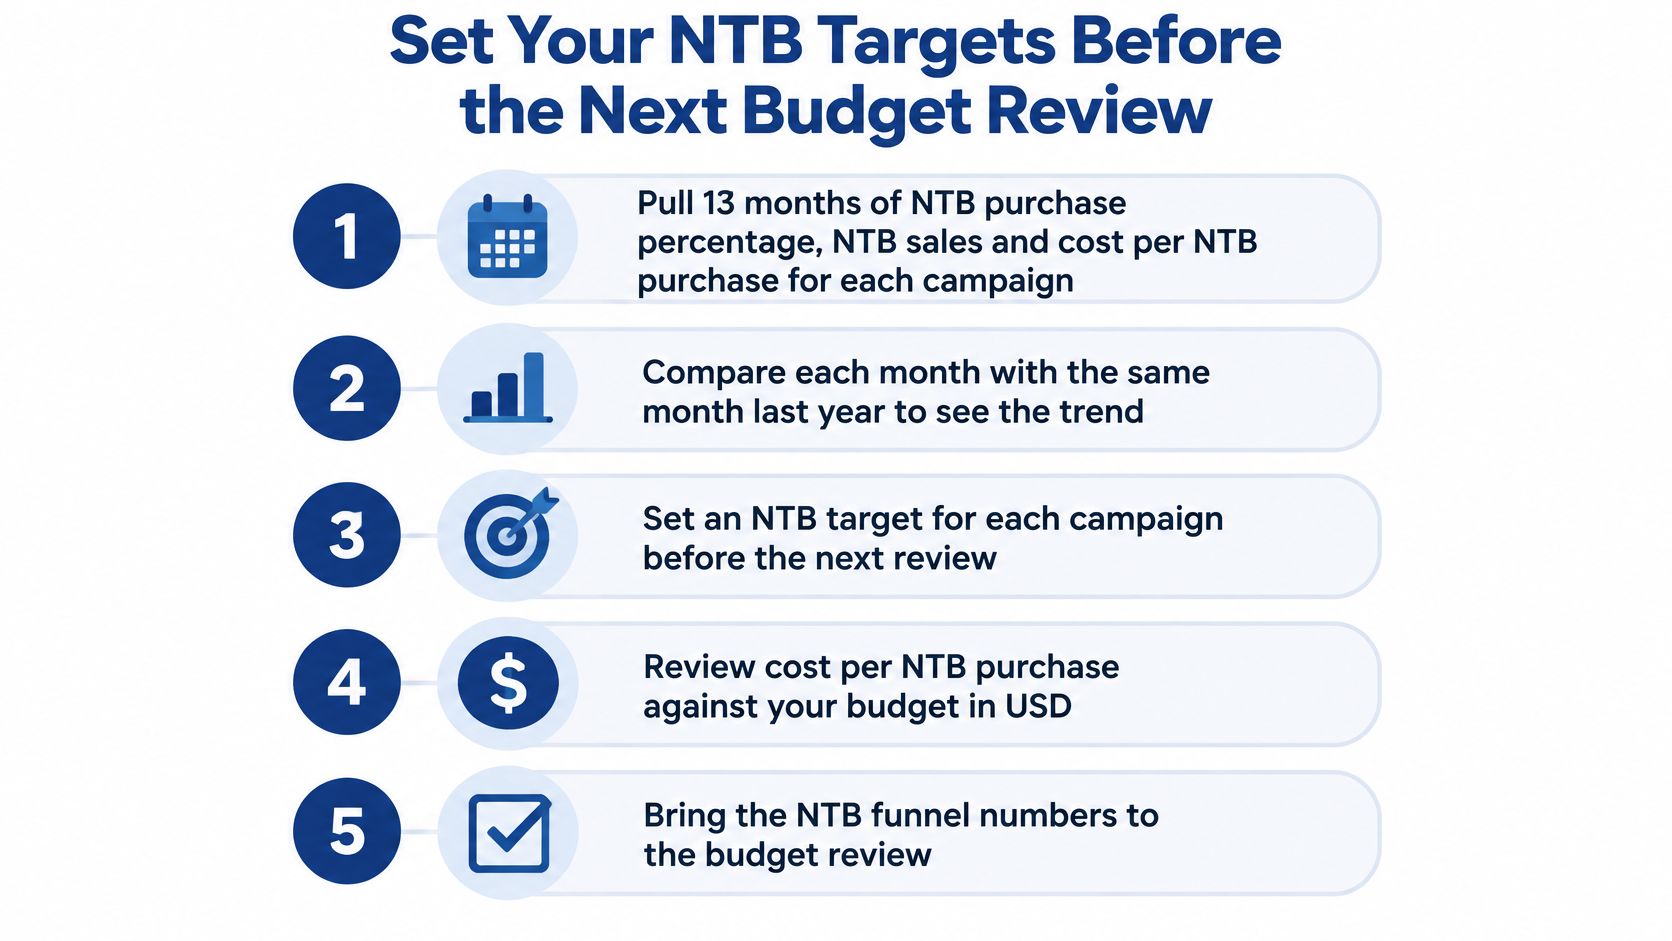
That list is deliberately unglamorous. It's also the difference between a report you read and a decision you can defend when the budget gets cut.
Running this as one system rather than five spreadsheets is where execution often stalls. Headline's Analytics Suite integrates data from Amazon Seller Central, the Amazon Advertising Console, third-party tools and Amazon Marketing Cloud into one unified view, so NTB share, cost per NTB purchase and margin sit in the same place. We also offer a free audit of your Amazon PPC campaigns, which gives a team its NTB baseline before anyone touches a budget.
My recommendation is narrow on purpose. Treat NTB share and cost per NTB purchase as the budget gate, and treat PPC as the lever for profitable, sustainable growth rather than a machine for buying cheap orders. Campaigns that pass both gates get more money. Campaigns that pass only one get a fix, not a raise.
If your NTB report is full of columns and short on decisions, Headline Marketing Agency runs Amazon PPC, DSP and Amazon Marketing Cloud analytics as one profit-focused system, tying new-customer acquisition to contribution margin rather than ACOS alone. We'll show you where your NTB share sits against benchmark, what each new customer costs you, and which stage of the funnel is leaking before your next budget review. Start with a conversation at Headline Marketing Agency and bring your last three months of NTB data.
Get Your Free Amazon PPC Audit
Discover untapped growth opportunities and see how our data-driven approach can improve your ROAS.
Get Free Audit →Wollen Sie Ihre Amazon PPC-Performance aufs nächste Level bringen?
Lassen Sie Ihre Amazon PPC-Kampagnen professionell analysieren und entdecken Sie neue Wachstumsmöglichkeiten.