Amazon A/B Testing Guide for Listings, Ads, and DSP
A practical A/B testing guide for Amazon: experiment design, sample size, significance, CTR and CVR metrics, AMC and Search Query Performance data, and how

Most Amazon A/B testing advice starts with “test your main image.” That's not wrong, but it's incomplete enough to be expensive. A main-image test can produce a misleading winner, a pricing experiment can contaminate its own control group, and a short-lived CTR lift can damage profitability once the full funnel catches up.
A reliable A/B testing guide needs to cover more than split-testing listing assets. It must explain how to form a falsifiable hypothesis, select the right metric, control for seasonality, resist false positives, and measure whether PPC and DSP create incremental growth beyond last-click reporting. The brands that scale sustainably aren't necessarily running the most tests. They're making fewer careless decisions because their experiments are designed to answer commercially important questions.
Why Most A/B Tests on Amazon Fail Before They Start
Amazon testing advice often begins with “test your main image.” That tactic can work, yet it says little about whether the experiment will produce a trustworthy commercial decision. Weak hypotheses, mismatched metrics, seasonal demand, and short reporting windows can turn an apparent winner into an expensive false positive.
A large ecommerce guide citing Optimizely research reports that only 12% of test ideas produce a statistically significant positive result, while multivariate experiments were reported as at least 1.5 times more successful than simple A/B tests. (ecommerce A/B testing research and guidance) Amazon sellers should not treat that finding as a reason to make every test more complex. It is a warning to prioritize ideas carefully before sending traffic into an experiment.
Controlled experimentation replaced personal preference with comparison. Ronald A. Fisher formalized randomization, replication, and blocking in agricultural field trials, and his 1925 book Statistical Methods for Research Workers helped establish the framework behind controlled experiments. Claude C. Hopkins later made comparative advertising tests more widely known through Scientific Advertising, published in 1923. (history and foundations of A/B testing)
Digital channels made that discipline operational at scale. Google ran its first A/B test on February 27, 2000, and Stanford reported that Google, Microsoft, and other major technology companies reportedly run more than 10,000 A/B tests each year. Wired also reported that Google ran more than 7,000 tests on its search algorithm in 2011. (Stanford's account of experimentation in the digital age)
Practical rule: A test earns its place when the result changes the next decision, whether that means scaling a winner, killing a losing test, or rejecting the original hypothesis.
Amazon teams still rely on screenshots, competitor listings, executive preference, and narrow reporting windows. Those inputs can suggest a test, but they cannot establish causation. A promotion, stock disruption, traffic-mix change, or seasonal demand shift can create a temporary CTR or CVR lift that disappears when conditions normalize.
Pricing requires extra caution. A time-sliced comparison can expose the control and treatment to different demand, competitor, and Buy Box conditions, so it is often the wrong design for marketplace economics. For price tests, teams should consider whether the design separates the treatment effect from changes in traffic, margin, and purchase behavior.
A disciplined operating process includes:
- Start with a commercial problem: Identify weakness in CTR, CVR, margin, organic visibility, or campaign efficiency.
- Write a falsifiable hypothesis: State the change, expected metric movement, and shopper reason.
- Choose the experimental unit: A listing asset, query, campaign, geography, product, or time block may require a different design.
- Pre-commit to analysis: Set the primary metric, guardrails, sample requirement, and stopping rule before launch.
- Check incrementality: Use AMC and Search Query Performance where available to test whether gains extend beyond last-click reporting.
- Record the result: A losing idea should not return in the next planning cycle under a new name.
Teams using AI-assisted research or creative generation can compare AI model options before building a workflow. Generated copy and images are starting hypotheses, not evidence. They still require controlled testing and a business metric.
Designing Experiments That Actually Isolate a Variable
Three decisions make a hypothesis testable: the change, the expected metric movement, and the shopper reason behind it. “Improve the listing” gives the team no clear test. A stronger hypothesis might state that changing the main image to show the product in use will increase CTR because shoppers cannot understand its scale or context.
Use this template:
Changing [one element] will affect [primary metric] because [shopper reason]. We will protect [guardrail metrics] and implement the result only if [decision rule].
The variable should match the surface being tested. A main image shapes the first impression and usually connects most directly to CTR. A title can affect search relevance and click behavior. A+ content, bullets, price presentation, and detail-page persuasion are more closely tied to CVR, although their effects can appear across several stages of the funnel.
Keep version A and version B meaningfully comparable
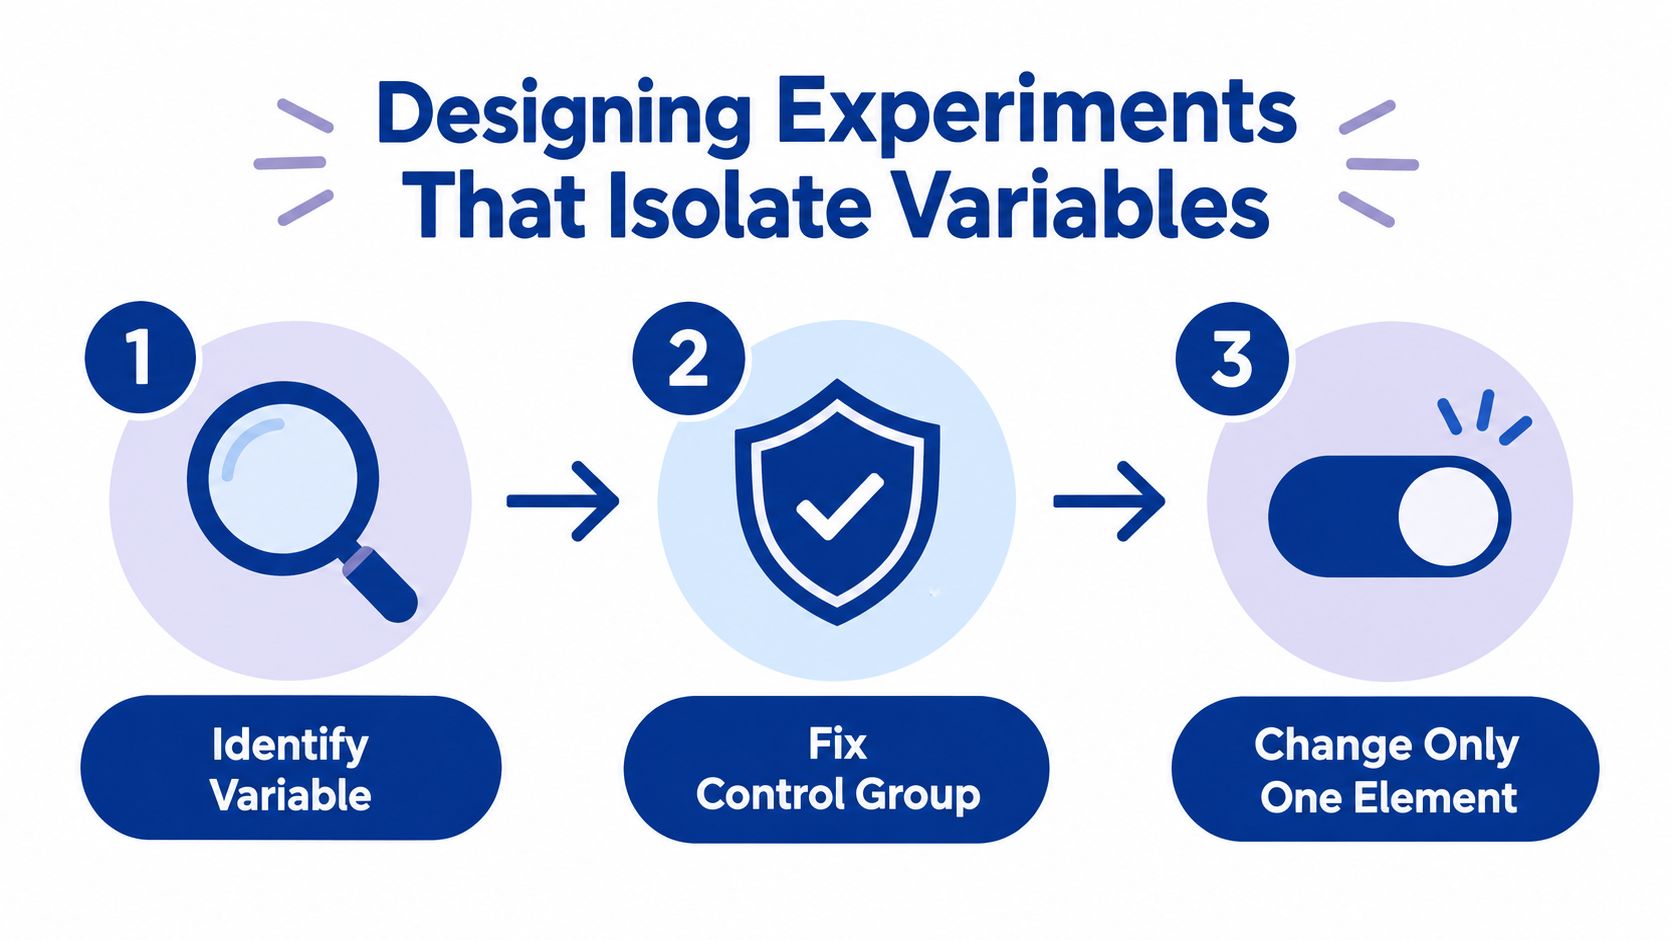
Version A should represent the current customer experience. It should not be an outdated listing that differs from the treatment in several unrelated ways. Version B should contain the planned change while preserving other factors that could affect performance.
Changing the hero image, title, price, coupon, bullets, and A+ content together may produce a stronger listing, but it cannot show which change caused the result. That weakens the learning event and makes the finding difficult to transfer to another ASIN or campaign.
Amazon's Manage Your Experiments tool randomly splits customers into two groups. One group sees Version A, and the other sees Version B during the experiment. Amazon also allows the winning content to be published when the experiment ends. (Amazon Manage Your Experiments documentation)
Third-party documentation describes the setup as an automatic 50/50 traffic split that sellers cannot manually adjust. The native tool therefore suits listing-content comparisons under controlled exposure, provided the seller changes one meaningful variable and leaves the control unchanged during the run. (Amazon experiment setup and traffic allocation)
Choose the surface that answers the question
If shoppers understand the product category but not its use case, test the A+ content that explains that use case. Keep the main image, price, and other detail-page elements stable so the result can be connected to the intended change.
For a Sponsored Brands question, test the headline or creative within the advertising surface. For DSP, compare audience-specific creative while preserving the audience, bid strategy, frequency controls, and landing destination as far as the platform permits. For offer messaging, test how the value proposition is framed before changing the underlying economics.
A practical data-driven offer testing guide can help teams separate offer variables across commerce channels. The same discipline applies on Amazon: isolate the proposition before optimizing the entire customer experience at once.
Sample Size, Statistical Significance, and Test Duration
A convincing Amazon test can still be wrong. The usual cause is operational: a team checks the dashboard every day, stops when the result moves in the preferred direction, and treats an interim result as the final decision. Random traffic movement, changing shopper intent, and seasonal demand can turn that apparent winner into a loss after publication.
Before launch, define the primary metric, select the confidence threshold, calculate the required sample size, and set the planned duration. Adobe warns that low observation counts increase the chance of lifts driven by randomness. Its guidance also recommends accounting for multiple comparisons and post-segmentation, including methods such as Bonferroni correction where appropriate. (Adobe guidance on common A/B testing pitfalls)
The errors that create false winners
Peeking remains the most common failure pattern. A seller sees B ahead after a few days, pauses the experiment, and publishes the change. Early results contain more random movement, so the apparent gain can reverse as traffic mix, shopping behavior, and demand settle.
Multiple variants create another source of false winners. Every additional comparison gives the team another opportunity to find a result by chance. The same problem appears when analysts review device, placement, audience, query, and day-of-week segments after the test, then report only the segment that looks favorable.
Underpowered ASINs require a different decision. If available traffic cannot detect the minimum effect worth implementing within a commercially sensible window, a weak result should remain inconclusive. Test a larger strategic change, use a higher-volume surface, or classify the exercise as directional research rather than a winner-selection test.
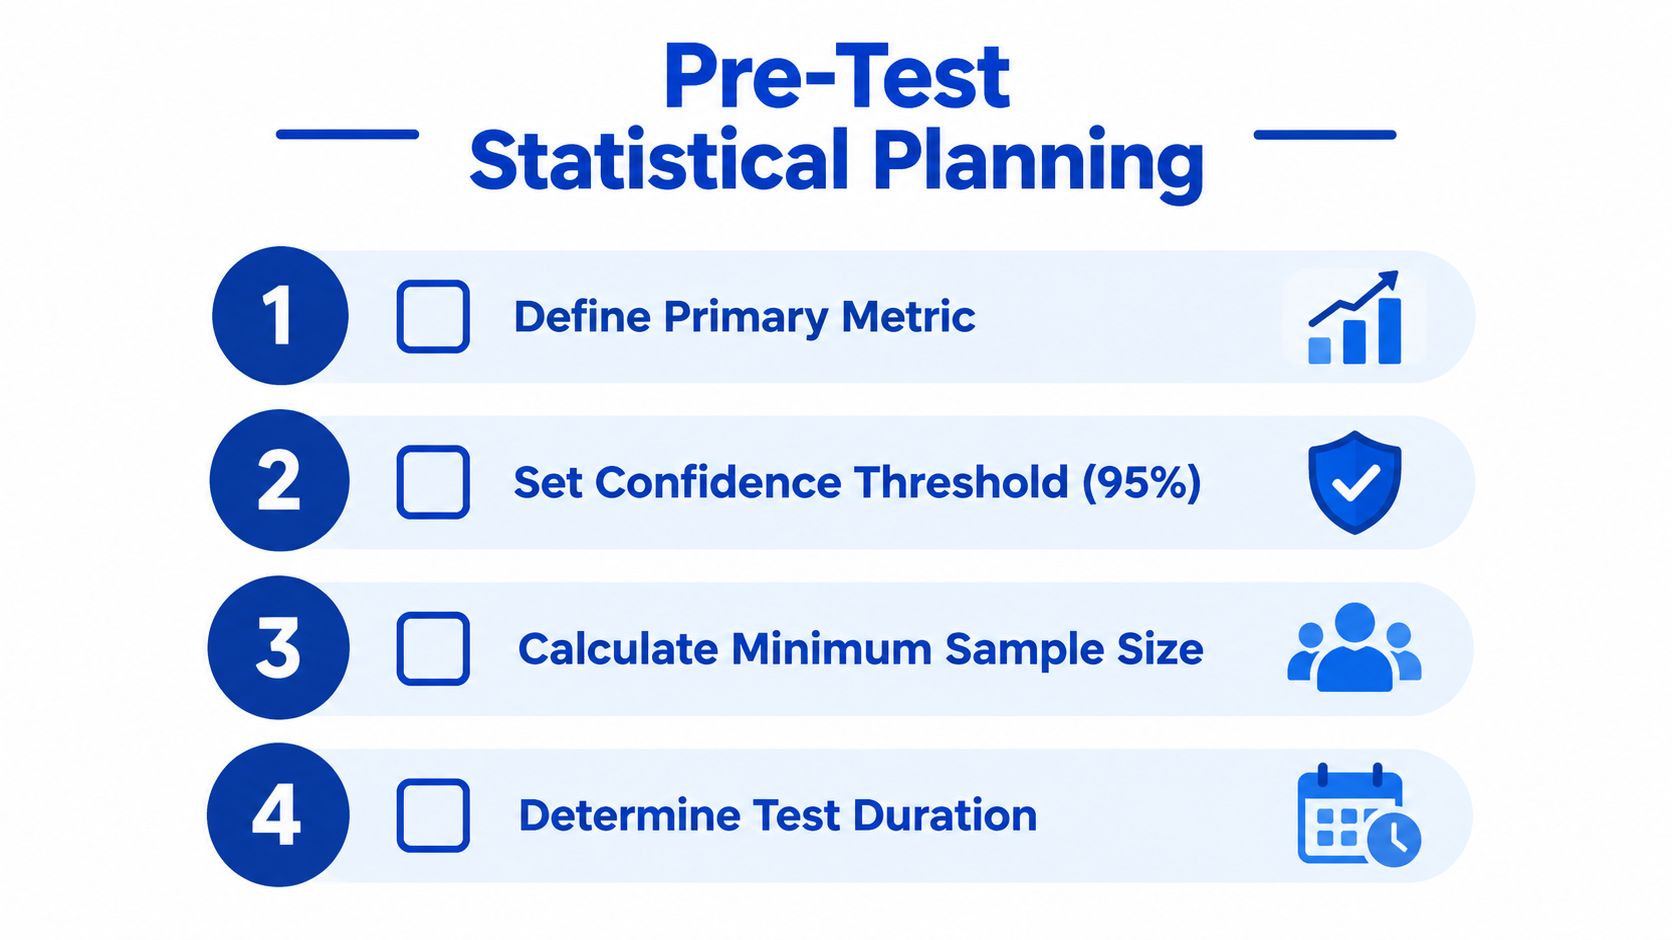
Amazon guidance commonly describes 14 days as a minimum testing period for listing experiments. Amazon-recommended fixed windows are also often described as 8 to 10 weeks when sellers manually select duration. Those timeframes support planning, but they do not replace it. A high-volume ASIN may reach its required sample sooner, while a low-volume ASIN may need longer observation or another design. (Amazon split-testing guidance)
A time-sliced before-and-after test is especially weak for pricing. Competitor offers, Buy Box ownership, inventory pressure, promotions, and demand cycles can change between periods, making marketplace economics look like a price effect. Use concurrent randomized exposure where the platform allows it. If that design is unavailable, document the confounders and treat the result as directional.
Amazon-focused guidance also recommends covering normal shopping-cycle variation instead of treating a few days as representative. One guide says Amazon currently recommends 8 to 10 weeks when duration is manually selected and warns that peeking, simultaneous variants, and insufficient samples can produce unreliable conclusions. (Amazon testing duration and common errors)
Don't stop because the dashboard looks good. Stop because the pre-agreed rule says the test has enough evidence, or because a serious guardrail failure requires intervention.
Use an approved sequential method if the business needs continuous monitoring. Otherwise, set the end date before launch, leave the test alone except for technical checks, and wait for the required data. Define the minimum effect worth implementing before launch, then reject changes that fail that commercial bar, even when the statistical result looks favorable.
Choosing Metrics That Tie Tests to Profitability
Match the primary metric to the decision surface, not the channel. Main-image and creative tests are click problems first. Price and A+ content tests are economics problems first. DSP holdouts require an incrementality measure that reaches beyond attributed orders.
CTR matters when the creative determines whether shoppers enter the detail page. Once shoppers arrive, CVR usually carries more weight for changes that remove doubt, clarify benefits, or improve offer comprehension. Neither metric captures profitability alone. A variant can attract low-quality orders, reduce basket value, increase refunds, or weaken contribution margin while producing a better headline result.
A practical metric plan looks like this:
| Test Surface | Primary Metric | Guardrail Metrics |
|---|---|---|
| Main image or Sponsored Brands creative | CTR | CVR, CPC, spend efficiency, branded versus non-branded traffic quality |
| Title or search-facing copy | CTR or qualified detail-page visits | CVR, organic query visibility, suppression risk |
| A+ content or bullets | CVR | Average order value, refund signals, contribution margin |
| Price, coupon, or offer framing | Contribution margin per order | CVR, revenue per visitor, Buy Box status, repeat purchase behavior |
| DSP creative or audience message | Incremental sales or qualified conversion | Reach quality, frequency, new-to-brand behavior, profitability |
| Full listing refresh | Contribution margin and organic sales trend | CTR, CVR, inventory position, customer experience signals |
Write down the financial definition of “better” before launch. A variant that raises CVR while lowering average order value may lose money. A creative that improves CTR but attracts less qualified traffic can make the top of the funnel look healthier while weakening the bottom. Contribution margin per order exposes that trade-off more clearly than conversion rate alone.
ACOS remains useful for campaign management, but it is an incomplete test metric. It does not show organic sales assisted by advertising, orders that would have happened without the ad, or purchases shifted between campaigns. Read ACOS alongside contribution margin, total sales, query-level behavior, and cannibalization signals.
Cannibalization needs its own guardrail. A new Sponsored Brands creative may take clicks from Sponsored Products or organic results instead of creating demand. A listing change may lift one ASIN while moving demand away from a complementary product. Track the primary metric for the test question, then protect the wider account with business-level measures.
Set the reporting view before the first result appears. For a broader framework on selecting business measures, use this Amazon KPI guide. The practical habit is simple: record the primary metric, guardrails, and minimum commercial improvement in the experiment brief, then judge the variant against all three.
Using Amazon Marketing Cloud and Search Query Performance Data
Listing split tests answer an asset-level question: did Version B outperform Version A under the chosen experiment conditions? They do not establish whether advertising created incremental demand for the brand. That distinction matters when a higher attributed conversion rate just reflects shoppers who would have purchased anyway.
Amazon Marketing Cloud supports discovery, measurement, experimentation, and validation across Amazon Ads channels. Analysts can connect exposure and conversion paths across Sponsored Products, Sponsored Brands, Sponsored Display, and DSP instead of judging each channel through isolated last-click reports. The Amazon Ads documentation on Amazon Marketing Cloud explains its role in working with advertising signals across these environments.
Use Manage Your Experiments for content decisions
Start with Amazon's native testing tool when the question concerns eligible brand-registered listing content. Hold the control stable, define one variable, and set the primary metric and guardrails before launch. The result can show which content version won under those conditions. It cannot prove that the listing change caused all later organic growth, or that the result will transfer unchanged to every ASIN.
Treat a winning result as evidence for the tested setup, not as a universal rule. Recheck the conclusion after traffic mix, inventory, or promotion conditions change.
Use AMC for channel-level incrementality
A geo holdout addresses a broader question than a listing test. Run advertising in 80% of regions and suppress it in 20% for 4 to 6 weeks, then compare total sales between treated and holdout areas. Because the comparison includes sales that may otherwise receive organic or another paid channel's credit, it can reveal whether advertising generated additional demand.
The regional design still needs careful matching, consistent suppression, and comparable sales conditions. A promotion in only one region, uneven inventory, or a market event affecting one group can make the result misleading. AMC provides the analysis layer. It does not repair a poorly selected holdout or weak experimental controls.
Use Search Query Performance to sharpen the hypothesis
Search Query Performance shows where a brand earns impressions, clicks, cart adds, and purchases, as well as where competitors capture parts of the customer journey. Use it to separate queries where the brand already owns attention from queries where it receives visibility but loses the click.
That distinction should shape the test. Branded queries with strong engagement may offer little upside from another brand-focused headline. A high-value generic query with impressions but weak clicks points toward a test of the main image, title, or Sponsored Brands message for clearer category relevance. Healthy clicks with weak purchases point elsewhere, such as the detail page, offer, reviews, or product-market fit.
Combine query behavior with AMC exposure paths and experiment results. This data-driven Amazon decision-making framework provides context for connecting those signals to commercial decisions, helping analysts test incrementality rather than treating last-click attribution as proof.
When Classic A/B Testing Is the Wrong Tool
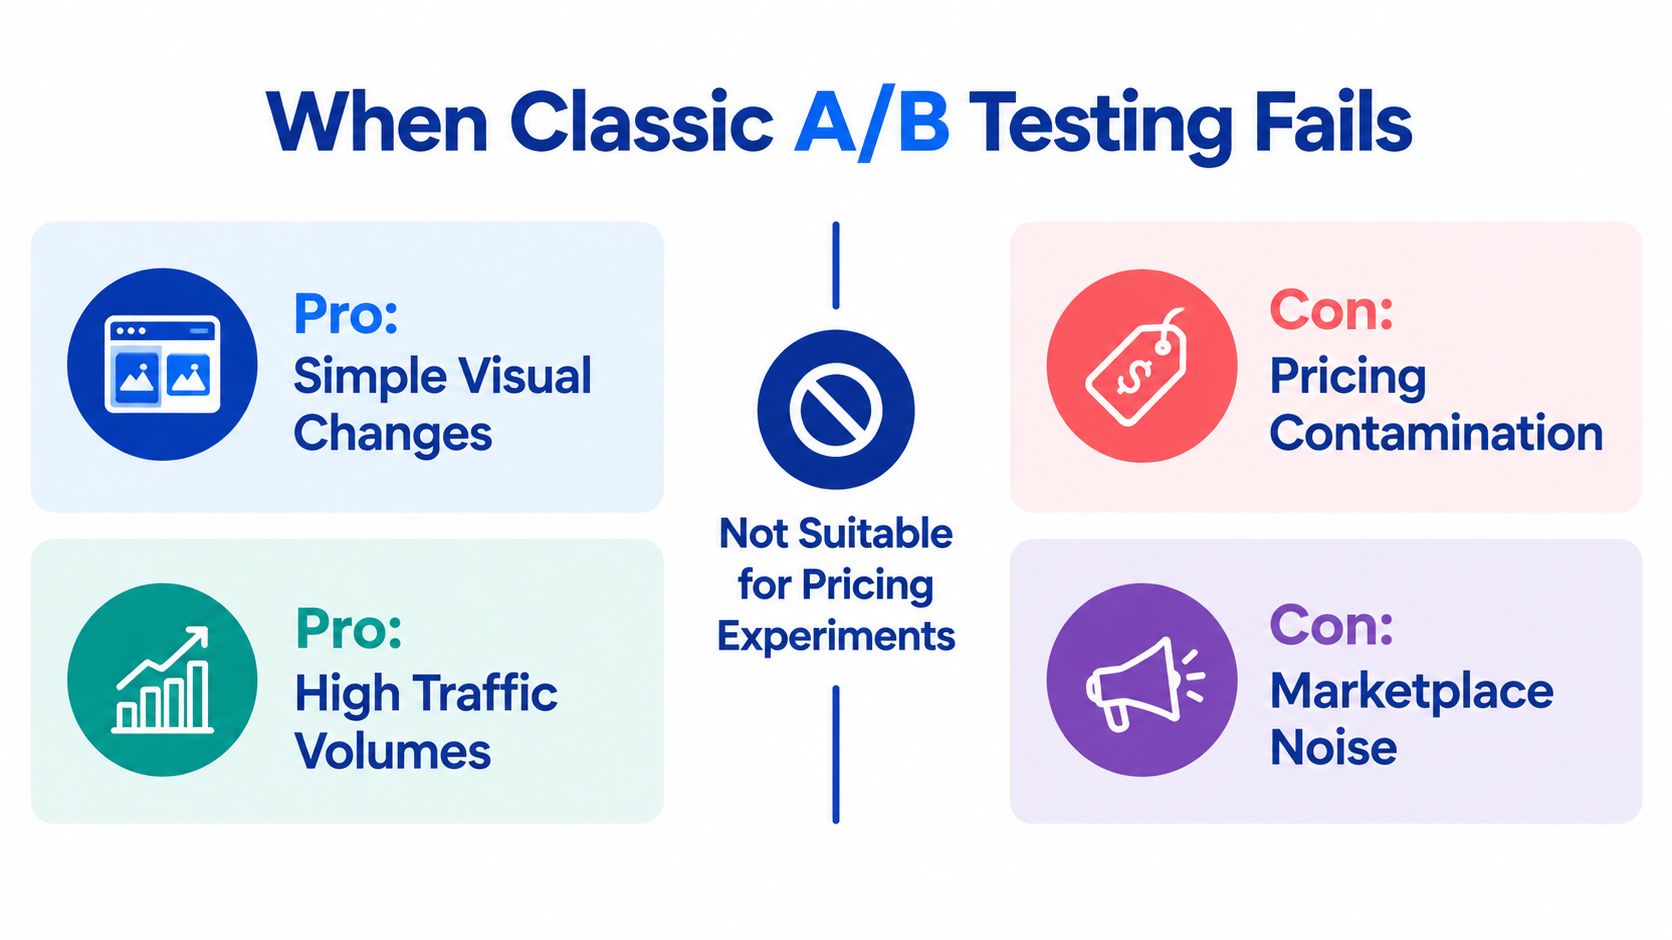
Time-sliced A/B tests are a clean design for visual changes, but they break down as soon as the decision affects marketplace economics.
Pricing exposes the problem. Shoppers may encounter different prices at different moments, competitors can react, inventory can change the offer, and marketplace rules may limit discriminatory treatment. Comparing “price A this week” with “price B next week” can mix the price effect with demand timing, competitor movement, and product-level differences.
Amazon Science's guidance on price experiment design explains why time-bound experiments are not always the right choice for pricing. Trigger-based or switchback-style designs can better account for timing, product effects, and nondiscriminatory pricing constraints.
Match the design to the source of contamination
Use a standard split test for a clean creative comparison when the platform can keep exposure stable. Choose a trigger-based design when the change follows a defined shopper or product event. A switchback design can control timing effects by alternating treatment states over time. Use a geo holdout when the question concerns total channel incrementality rather than the performance of one asset.
The stopping rule matters as much as the test design. Stop early when the experience is clearly broken, a guardrail suffers severe damage, or inventory risk becomes material. A disappointing interim result is not enough. If a test is losing before it reaches its planned evidence threshold, keep it running unless the expected cost of continuation is material and the approved stopping rule permits an early decision.
AI simulation has a similar boundary. Simulated outcomes can overstate likely effect sizes, so use them to prioritize ideas and allocate testing effort, not to replace a live experiment.
Use complexity only when the question requires it
Multivariate designs can justify their cost when elements interact and traffic supports the required combinations. They do not compensate for weak traffic. Each additional combination receives less evidence, while interpretation becomes harder and false positives become easier to accept.
Teams managing complex creative systems can use resources on scaling B2B ad creatives to structure creative variables and production trade-offs. Amazon marketplace tests still require their own controls, especially around exposure, price, inventory, and attribution. For tool selection, compare Amazon ad creative testing tools with the surface, audience, and decision under evaluation.
The practical question is not whether an A/B test can run. Define the unit of randomization, identify likely contamination, set the stopping rule, and choose the design that produces evidence the business can trust.
Turning Test Learnings Into a Compounding Advantage
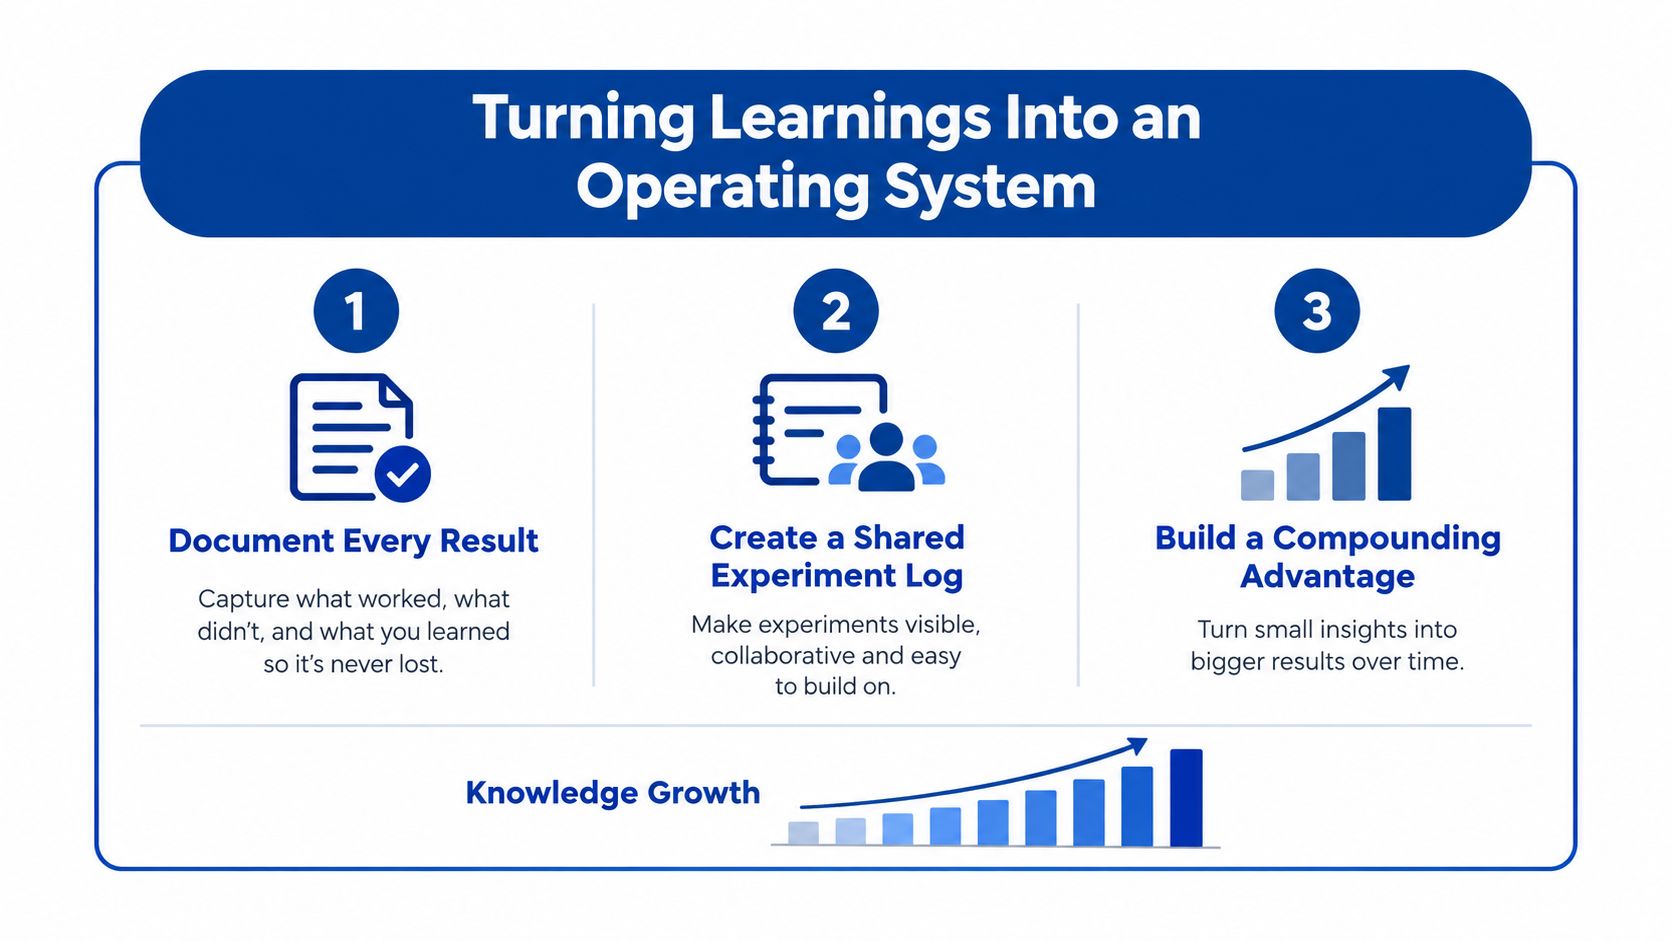
A test becomes valuable when the result changes the next test, the next listing update, and the next media decision. That requires an operating system rather than a folder of screenshots.
Document the hypothesis, audience, ASINs, control and treatment, dates, primary metric, guardrails, sample plan, result, decision, and interpretation. Include inconclusive tests and losses. A losing image may reveal that shoppers value product clarity over lifestyle context. A losing offer may show that margin protection matters more than a short-term conversion push. Those insights belong in the same searchable record as the winners.
Build the loop
- Document every result: Record what changed and what the result can and cannot prove.
- Create a shared experiment log: Prevent teams from repeating failed hypotheses and make patterns visible across categories.
- Propagate validated learning: Apply a confirmed creative or message insight to relevant ASINs, Sponsored Brands campaigns, and DSP creative, then monitor whether the effect transfers.
- Re-test when conditions change: Competition, price, inventory, shopper intent, and seasonality can change the answer.
- Prioritize the next quarter: Rank ideas by expected commercial impact, evidence quality, implementation effort, and available traffic.
PPC should be treated as more than a short-term sales channel. A well-designed advertising test can improve the message that earns the click, the listing that converts it, and the organic relevance signals that support sustainable scale. But the business should judge the result through profitability, incremental demand, and organic growth, not ACOS in isolation.
That is the mature standard: disciplined experiments, explicit economics, clean measurement, and a shared memory of what shoppers did. Start with one commercially important hypothesis, define the decision before launch, and refuse to call noise a win.
Headline Marketing Agency offers Amazon PPC and DSP management with A/B testing strategies, Amazon Marketing Cloud analysis, Search Query Performance insights, and content optimization tied to CTR, CVR, profitability, and organic growth. Visit Headline Marketing Agency to discuss a testing program built around your catalog, advertising data, and marketplace goals.
Get Your Free Amazon PPC Audit
Discover untapped growth opportunities and see how our data-driven approach can improve your ROAS.
Get Free Audit →Ready to Transform Your Amazon PPC Performance?
Get a comprehensive audit of your Amazon PPC campaigns and discover untapped growth opportunities.