Amazon Niche Market Guide: How to Judge Viability
Amazon niche market explained: how to score demand, competition, margins and seasonality, with thresholds and a worked margin example before you launch.


The most popular advice about finding an Amazon niche market is incomplete: look for demand, avoid competition, then launch. Neither demand nor an empty search-results page proves that a product deserves your capital. The deciding question is whether you can acquire customers and still keep a contribution margin after advertising, fees, returns, and inventory costs.
Start with the economics. Then test whether a specific audience will buy your differentiated offer. Use PPC to validate that decision and build organic visibility, not to disguise a product that can't pay its way.
What an Amazon Niche Market Actually Is
A narrow audience can still support a business, while an empty search results page can signal a market too small to enter. Define the buyers and the problem before deciding that a niche is attractive.
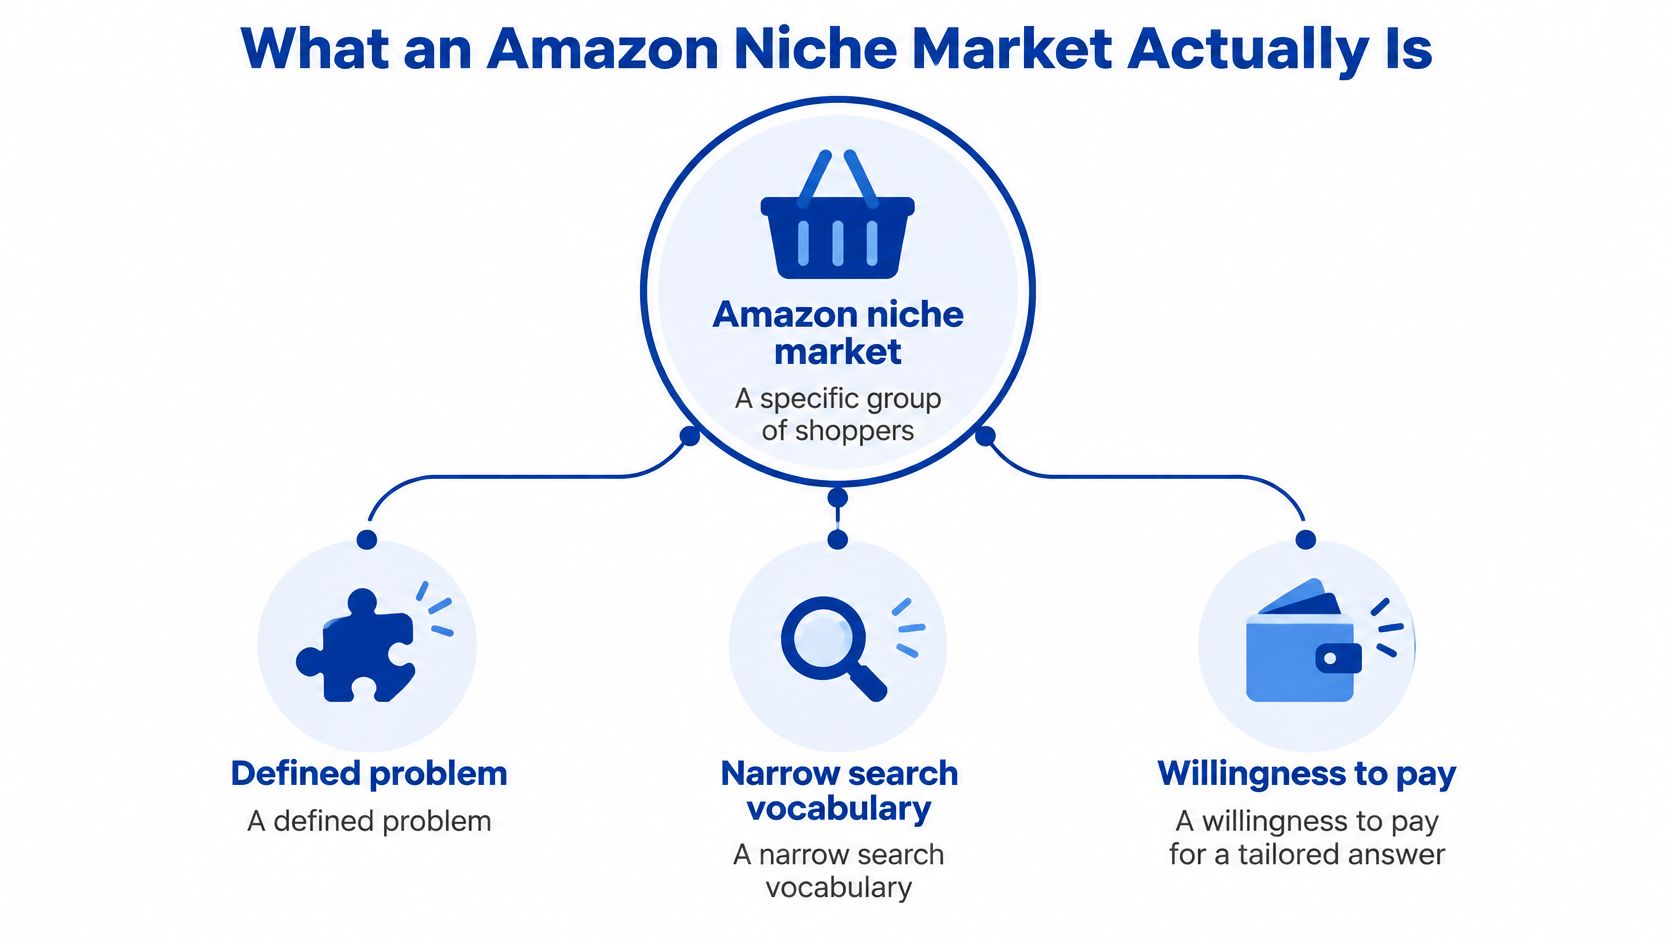
An Amazon niche market is a specific group of shoppers with a defined problem, a narrow search vocabulary, and a willingness to pay for a solution that fits their needs. The audience must be identifiable through relevant searches, and those searches must connect to real buying intent.
Consider this product path:
- Category: Kitchen.
- Subcategory: Knife sharpeners.
- Niche: Sharpeners for hunting knives used outdoors in wet conditions.
The niche describes the customer's situation, not just the product or category. A kitchen buyer may prioritize countertop storage. An outdoor user may value grip, portability, and reliable operation when equipment is wet. Treat those as product-development hypotheses, then check whether shoppers search for and buy solutions that address them.
The concept map shows the components that need to overlap.
Specific doesn't mean commercially small
Judge size through the relevant query cluster, not Amazon's total marketplace. Group the searches that describe the same problem, then assess whether they represent enough shoppers with purchase intent to support the sales volume your economics require. A high-volume generic term can attract the wrong buyers. A focused cluster can be more useful if it reaches shoppers seeking the specific solution.
Low competition alone is not proof of opportunity. Few listings may reflect weak demand, unclear purchase intent, or a product that is difficult to sell profitably. Treat low competition as a reason to investigate, not a reason to commit.
A useful niche definition tells your product team what to build, your content team what to explain, and your media team which searches deserve money.
Before approving a launch, ask whether the query cluster can support enough buyers and whether a new brand can earn sales without sacrificing contribution margin. A precise audience description helps teams make those decisions. It does not, by itself, justify the investment.
Viability Thresholds for Demand, Competition, Margin and Seasonality
Demand and low competition do not prove a niche can make money. The deciding test is contribution margin after advertising and fees. A niche with few competitors can signal weak demand, difficult sourcing, or a market too small to support a new offer.
| Criterion | Working pass guideline | Warning sign | Why it matters |
|---|---|---|---|
| Keyword relevance | 30–60% of estimated search traffic matches the core product promise | One term drives nearly all demand, or relevance falls below 30% | Relevant searches offer a better chance of reaching the right shoppers |
| Revenue concentration (Gini) | Below 0.50 across the top 20 listings | 0.50 or higher, with the top two listings taking most revenue | Concentrated sales can make entry harder |
| Projected gross margin | Above 30% before advertising | Below 30%, or viable only at one supplier price | Thin gross margins leave little room for acquisition costs |
| Contribution after ads | Positive at a target ACOS of 20% or lower | Negative at a realistic ACOS | Sales need to cover acquisition costs and still contribute |
| Review velocity | Top 10 listings continue adding reviews monthly | Top 10 listings have stalled for six months or more | Stalled activity calls for a closer demand check |
| Seasonality | Peak month is within about 2x the trough, recurring across 2–3 years | One spike is followed by a collapse | Repeatable demand makes inventory planning more reliable |
| Demand stability | Trough months clear break-even sales volume across 3 years | Trough months fall below break-even volume | Slow periods still need to cover operating needs |
| Return and compliance risk | Returns leave margin intact, with no certification blocker | Fit issues drive returns or certification hurdles remain unresolved | Returns and compliance can erase the margin |
These thresholds are operator-level working guidelines, not sourced benchmarks or universal rules. Use them to compare candidates consistently, then verify the assumptions with listing, supplier, and cost data. The relevance band and concentration cutoff help flag questions; neither proves that a market is viable. In particular, treat the advertising target and seasonality tests as screening choices, not fixed standards.
Read relevance and concentration correctly
Keyword relevance is the share of estimated niche search traffic that matches the product's core promise. The working band points to a meaningful pool of relevant searches, not a guaranteed conversion rate. A higher share is not automatically a problem. Check whether the niche definition is too narrow or the audience is focused.
The Gini coefficient describes how unevenly revenue is distributed across listings. Zero means revenue is evenly distributed; one means it is concentrated in a single listing. Use the score as a prompt to investigate, not as proof that a new seller cannot enter.
Revenue estimates for competitors are imperfect. Check what drives the leaders' sales: product features you can match, brand preference you cannot quickly reproduce, or pricing you cannot sustain profitably. Use this guide to assess market saturation and distinguish a crowded category from one with little remaining room.
Screen the operating model too
A coffee-related candidate needs supplier quotes and lead times before you can judge its economics. PureHQ Inc.’s guide to sourcing wholesale coffee accessories can help frame supplier questions. It is a starting point for sourcing research, not evidence that a niche will be profitable.
Count passes across all eight criteria, but do not let an average hide a serious weakness. A margin failure is a no-go. Seasonal demand can work when inventory is planned around the cycle. A brief spike followed by disappearing demand needs a different business case, and may be a warning rather than an opportunity.
How to Research a Niche Step by Step
Research should produce a decision sheet, not an enormous keyword export. Keep the method consistent across candidates so your team can compare opportunities without changing assumptions to favor its preferred product.
Start with the language customers use.
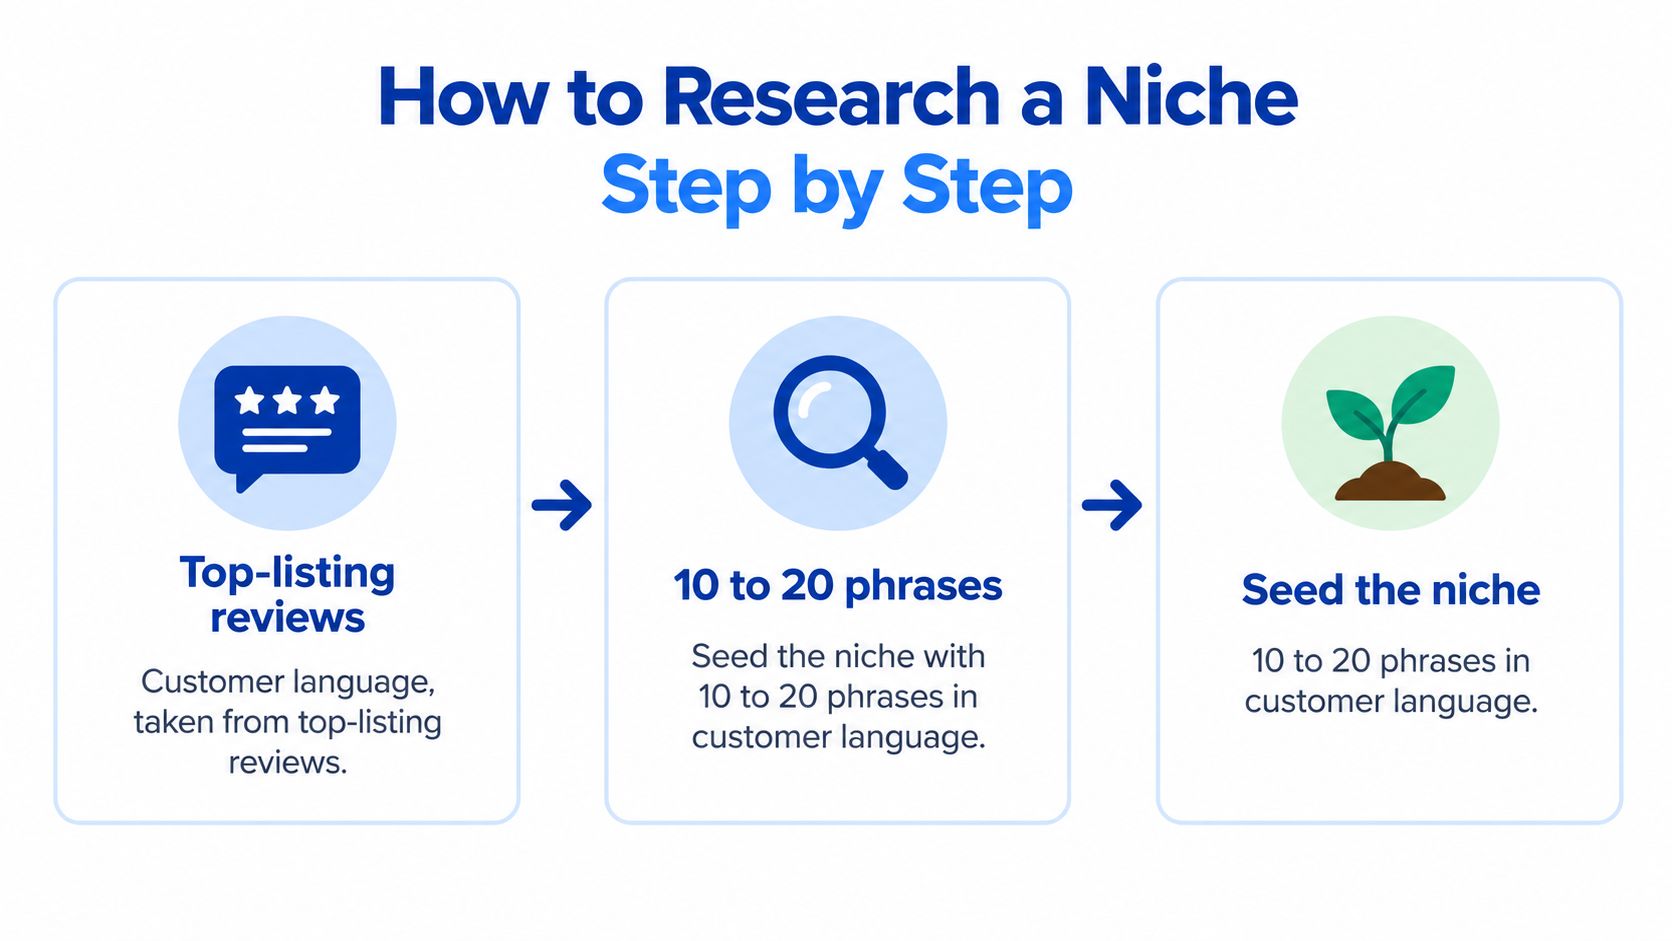
Seed with customer phrases. As a practical research sample, collect 10 to 20 phrases from top-listing reviews and Amazon search suggestions, rather than limiting the list to your internal product terminology. Capture the task, environment, frustration, and desired outcome.
Group phrases into use-case clusters, placing hunting-knife sharpener and outdoor knife sharpener together when they describe the same job. Don't organize the research around competitor brand names, which can obscure the underlying need.
Estimate demand consistently. Use one third-party search-volume tool, compare candidates within the same date window, and check phrasing against Amazon suggestions. Treat estimates as ranges, and use Amazon search-term research for context rather than assuming popular searches equal accessible customers.
For the lead query, record the top 20 results as a working sample, including price, review count, estimated monthly sales, and sponsored status. Separate sponsored placements from organic positions so paid visibility doesn't distort your interpretation.
Calculate concentration. Apply a spreadsheet Gini formula to estimated monthly revenue across that sample and record the top-two revenue share beside it. Don't treat a precise formula as proof that the underlying sales estimates are precise.
Count reviews added during the last 90 days for the top 10 listings, using a consistent collection method. Reviews are a proxy for activity, not a sales ledger, so investigate gaps instead of converting them directly into orders.
Check the full seasonal cycle. Pull 36 months of available trend data and apply the peak, trough, and repeat-year guidelines in the scorecard. Don't confuse a promotional surge or stockout recovery with enduring demand.
Read one- to three-star reviews and log unmet needs involving fit, durability, handling, or instructions. Separate problems your product can solve from complaints that reflect unavoidable category trade-offs.
Document operational blockers. Record return exposure, safety obligations, certification requirements, and supplier dependencies. Don't approve the niche while those costs remain unpriced.
Turn research into a comparable decision
Create a one-page niche sheet carrying all nine research outputs, their collection dates, and any unresolved assumptions. Put candidates side by side and mark which conclusions depend on estimated data versus information you can verify through quotes or your own test.
Use the discussion below as an additional prompt for evaluating competitive positioning, not as a substitute for your economics.
Assign an owner to every unresolved assumption. If nobody is responsible for validating returns, compliance, or supplier pricing, those omissions will survive into the launch budget.
Margin Math That Decides Whether a Niche Pays
Consider an illustrative product selling for $35. Assume a referral fee of 15%, or $5.25, fulfillment of $6.50, and product cost of $9.00. That leaves $14.25, or 40.7%, before advertising and the additional costs discussed below.
These are example inputs, not current Amazon fee quotations. The following figures are arithmetic based on those assumptions.
| Target ACOS | Ad cost per $35 sale | Contribution after ads | Margin on price |
|---|---|---|---|
| 10% | $3.50 | $10.75 | 30.7% |
| 20% | $7.00 | $7.25 | 20.7% |
| 30% | $10.50 | $3.75 | 10.7% |
| 40% | $14.00 | $0.25 | 0.7% |
| 45% | $15.75 | -$1.50 | -4.3% |
Break-even ACOS equals the pre-ad contribution margin percentage, provided both calculations include the same costs and sales basis.
In this example, an ACOS around the pre-ad margin consumes almost everything available. The apparent surplus near break-even isn't meaningful protection once omitted expenses enter the model.
Include the costs that change the answer
ACOS is advertising spend divided by attributed advertising sales. It describes acquisition efficiency, not business profitability. Your finance team still needs to account for the full economic cost of those orders.
- Returns and refunds: Include return-processing costs, unrecovered fees where applicable, and inventory that can't be resold at its original value.
- Inventory carrying cost: Account for storage, financing, and cash tied up in slow-moving units.
- Price tolerance: Model the price shoppers will accept, not the price required to make your spreadsheet attractive.
- Landed-cost exposure: Include freight and other acquisition costs in product cost rather than leaving them outside the calculation.
The risk is concrete: more than 50% of surveyed sellers reported lower profitability in 2024, while 67% raised prices after FBA fee increases and nearly 60% of those still experienced lower profits. Raising prices isn't a reliable escape route.
Preserve room for uncertainty
My working rule is to target ACOS at no more than about half the fully costed pre-ad margin. That's a planning recommendation, not an industry benchmark. It reserves capacity for price pressure, fee changes, and estimation error.
Practical rule: Don't approve a product because it breaks even under favorable assumptions. Approve it because it remains acceptable when those assumptions deteriorate.
Use an Amazon seller profit calculator to replace the example inputs with current fees and your own landed costs. Keep launch-investment spending separate from the steady-state model so a temporary acquisition budget doesn't become a permanent excuse for negative contribution.
Narrow Angles Inside Big Categories
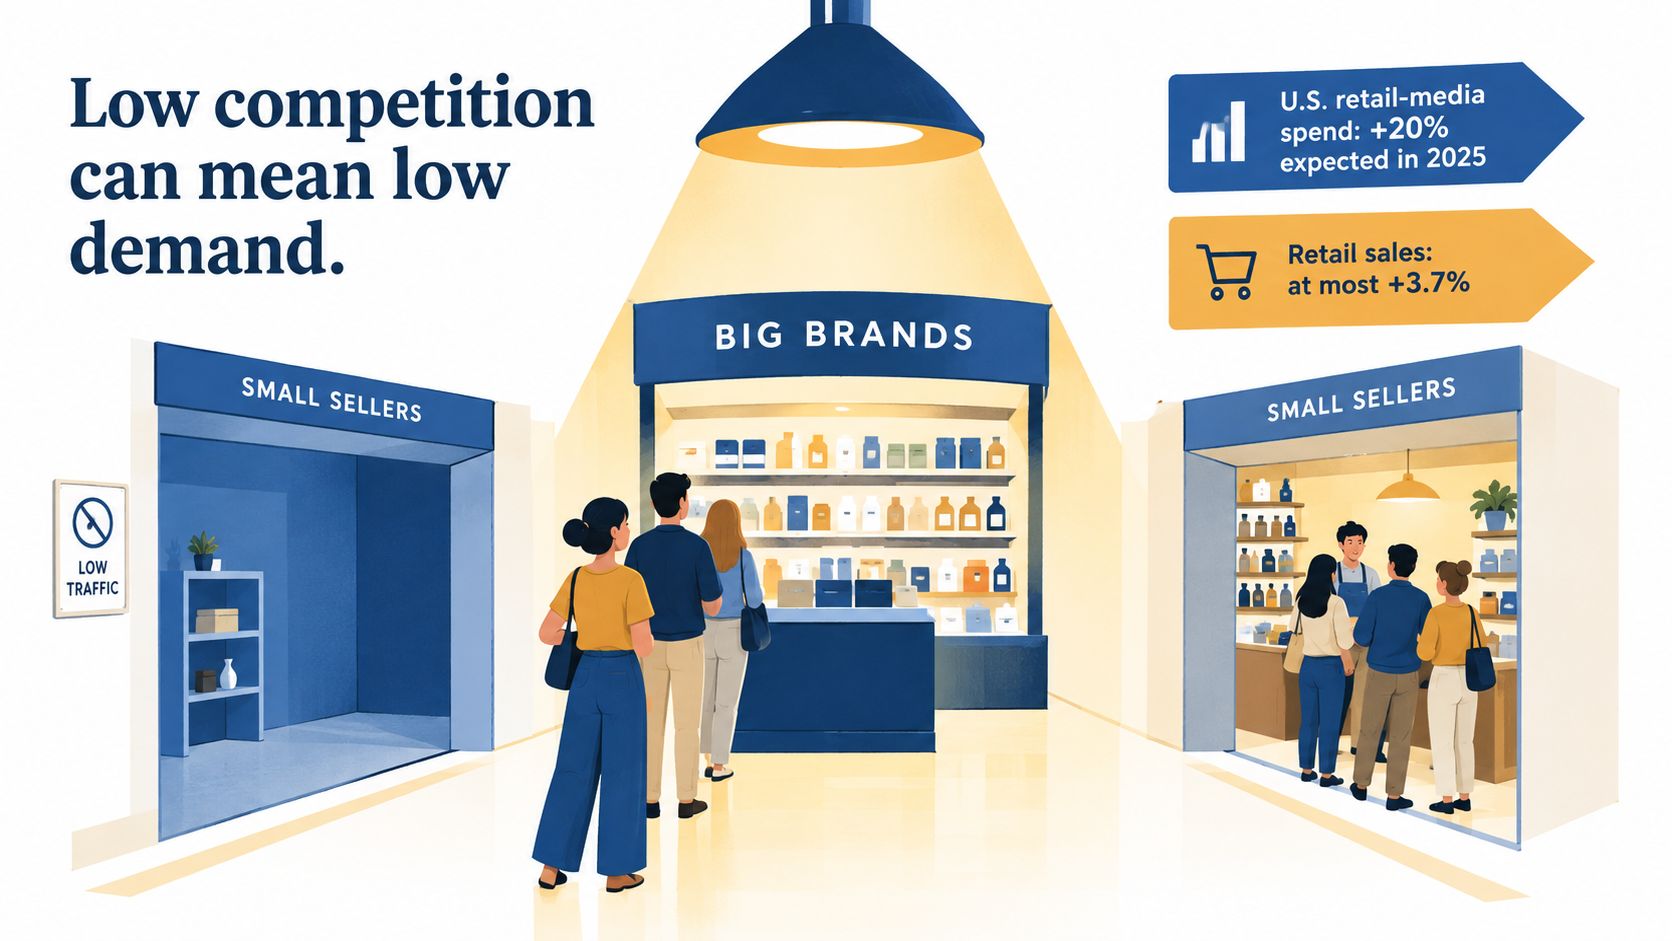
Low competition can signal weak demand, not an open opportunity. A quiet results page may point to an overlooked audience, or to shoppers who rarely search for the product, won't pay enough, or see no reason to buy a specialized version. Judge the niche by whether its contribution margin can survive advertising and fees, not by the number of competing listings.
A marketplace analysis projected U.S. retail-media spending growth of 20% in 2025 against retail-sales growth of at most 3.7%. That is a forecast about retail-media spending compared with retail-sales growth. It does not show that CPC or acquisition costs will rise at the same rate in a particular category. Use it as context for planning, then test your own unit economics.
Fewer sellers do not automatically mean more customers.
Test audience size, intent, and reach
Running shoes for wide feet show how to test audience size within athletic footwear. Start with your monthly unit goal. Work backward using realistic conversion, click-through, and impression-share assumptions. Search volume only matters if the portion you can reach supports that goal at a contribution margin that holds after ads and fees.
For cast iron cleaning tools for people with arthritis, check whether the search signals a specific task and buying intent. A query that names a product, use case, or relevant feature can point to a defined need. “Best” alone does not prove shoppers are ready to buy. Look for shoppers describing grip difficulty, then confirm your product visibly addresses it. Avoid medical claims you cannot support.
A commute bag for cyclists in wet climates tests whether the audience is reachable through a suitable channel. You could test Sponsored Products keywords, a Sponsored Brands consideration message, or a DSP audience around the same customer problem. Confirm that the audience is available and that the economics work before committing budget.
Make specificity visible in the offer
Nothing But Bands' Garmin Forerunner straps offer a merchandising reference for organizing an accessory around named-device compatibility. That does not establish Amazon sales or profitability. Check whether shoppers can identify the compatible devices from the product, images, and instructions without having to infer the fit.
A crowded category can contain an unmet use case. A quiet category can contain no viable business.
Before choosing an angle, compare its search terms with actual listing reviews and questions. Confirm that shoppers describe the problem, that your product addresses it visibly, and that the reachable demand can support your target contribution margin after advertising and fees. If one of those checks fails, reject the angle or revise the offer before investing.
Using PPC to Prove Demand and Build Organic Rank
Low competition does not prove a niche is attractive. It can signal weak demand. Use PPC to test whether shoppers buy at a cost the product can support, then check whether query coverage and organic visibility improve. Contribution after advertising and fees decides viability.
Amazon reports an average 50% lift in weekly units ordered and a 30% increase in glance views within a year of launching Sponsored Products. Those are averages across ASINs, not forecasts for an individual niche. Track attributed revenue alongside contribution, and remember that the reported changes do not establish what would have happened without ads.
Search Query Performance provides a query-level measurement context for Search Query Performance. Use it to assess performance on priority queries. Treat a relationship between sales and query coverage as an association, not proof that higher bids cause organic rank gains.
Measure the whole purchase path
Amazon's Search Query Performance reporting documentation describes the available report types. Set your own review cadence: check weekly for bid or stock problems, review monthly for keyword and creative decisions, and assess quarterly whether demand is durable.
The action thresholds below are proposed operating rules, not Amazon benchmarks.
| Metric | What it shows | Act when |
|---|---|---|
| Query-level purchase share | Your share of purchases on a priority query | Rising for two consecutive months: consider expanding cluster bids if contribution holds |
| Cart-add share | Your share of basket additions | Below purchase share: inspect listing, images, and price before making changes |
| Glance views per week | Product-page visibility | Rising while ACOS holds: keep budget steady and check contribution |
| Units per week, 90-day trend | Order velocity after campaign launch | Flat after 90 days: revisit the product angle |
| Contribution after ads | Profit after included fees and advertising | Negative at target ACOS: cut spend or test a price change that could work economically |
| New-to-brand share | Acquisition beyond existing buyers, where reported | Low share: broaden eligible targeting or evaluate DSP |
Read funnel-share differences in context. Cart-add share below purchase share can still accompany strong purchase conversion. Check absolute counts, trends, and comparable periods before deciding the listing needs work.
Test creative against contribution
Amazon reports 67% higher click-through rate and 9% higher conversion rate for Sponsored Products campaigns using video compared with those without video. Treat the comparison as directional. Test video against static assets on priority queries, then judge performance on contribution after ads, query-level share, and organic movement together. More clicks do not help if acquisition costs consume the product's margin.
Confirm the Niche Before You Commit Budget
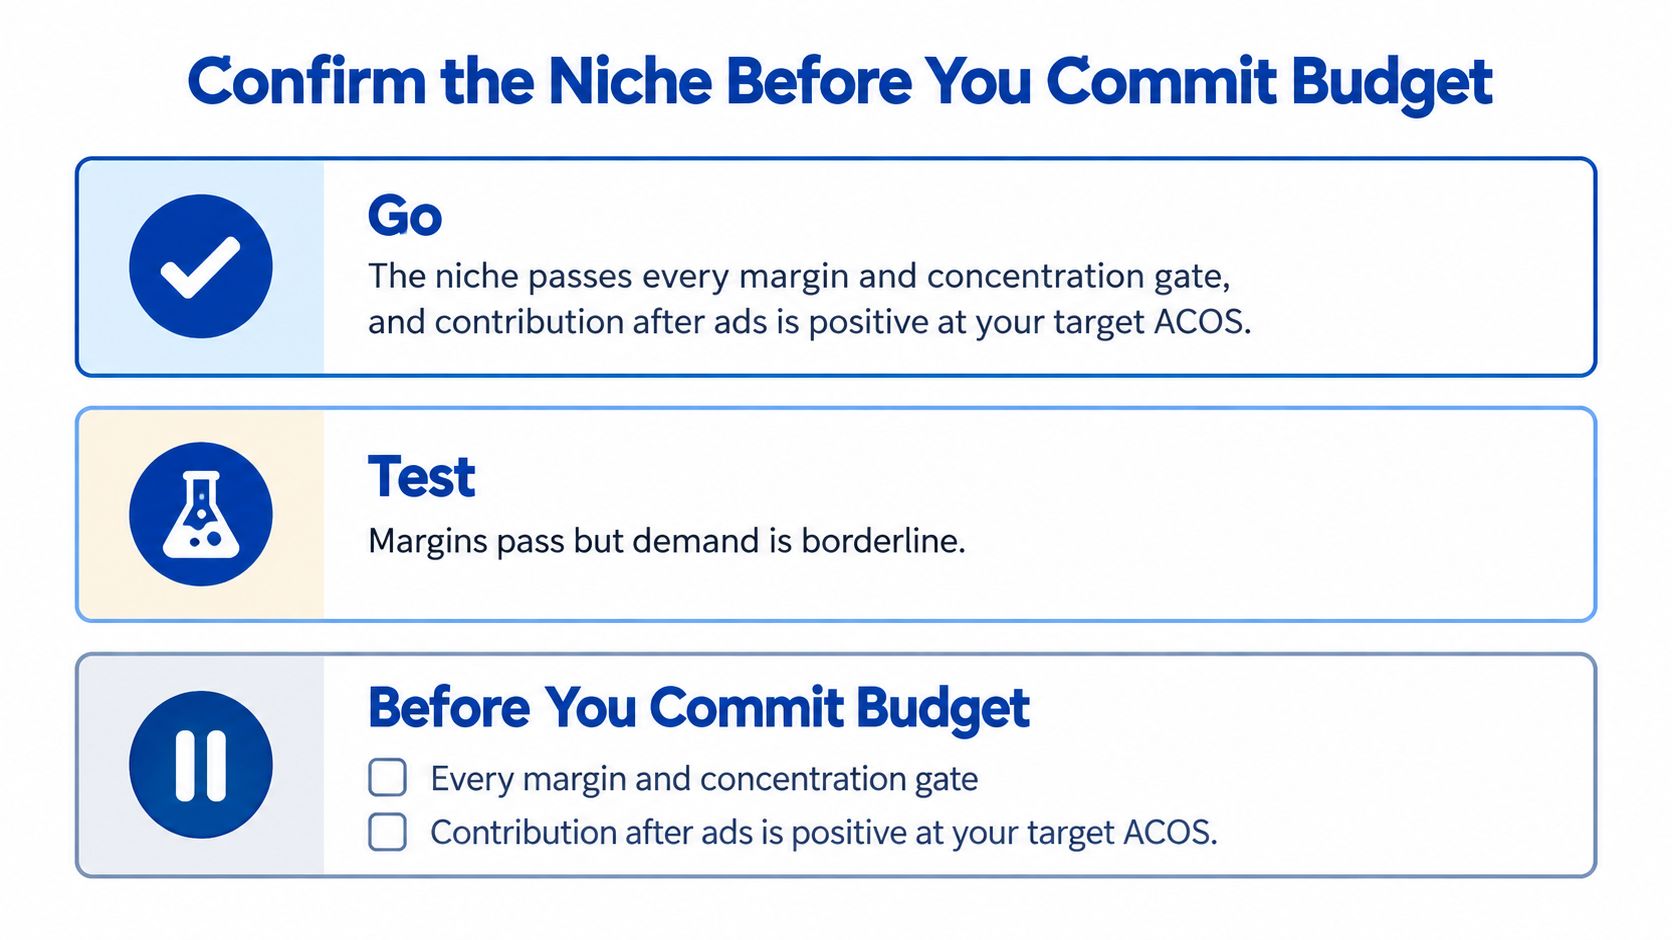
Give every candidate a clear verdict. Don't let an unresolved spreadsheet become an approved purchase order.
- Go: Every margin and concentration gate passes, and contribution remains positive at the target ACOS.
- Test: Margins pass but demand is borderline. Use a proposed 60-day capped test of two query clusters, comparing video with static creative and judging the result on contribution.
- No-go: A margin gate fails, or viability depends on a single search term or an unprotected supplier price.
Use the decision framework to keep approval tied to evidence.
Require an investment-ready file
Before committing inventory, require these deliverables:
- Complete margin sheet: Current fees, landed costs, returns, and carrying costs.
- Priority query clusters: Three distinct clusters with a clear product-to-query match.
- Trough-month plan: Inventory and cash requirements for slower demand.
- Downside scenario: As a planning stress test, raise freight and fees by 10% and reassess contribution.
- Defensible listing angle: A specific unmet need identified in reviews and answered by the product.
Keep the test budget capped until the evidence supports expansion. If the results are ambiguous, identify the missing evidence rather than labeling the launch successful because it generated orders.
This week, fill in the margin table with your real costs. Have finance verify the inputs and your media owner confirm the acquisition assumptions before anyone commits inventory.
Headline Marketing Agency offers query-level testing across Sponsored Products, Sponsored Brands, and DSP, with campaign decisions grounded in profitability, organic ranking, and sustainable growth rather than ACOS alone. Bring your niche shortlist and completed margin model to Headline Marketing Agency to plan a controlled test before expanding your advertising budget.
Get Your Free Amazon PPC Audit
Discover untapped growth opportunities and see how our data-driven approach can improve your ROAS.
Get Free Audit →Wollen Sie Ihre Amazon PPC-Performance aufs nächste Level bringen?
Lassen Sie Ihre Amazon PPC-Kampagnen professionell analysieren und entdecken Sie neue Wachstumsmöglichkeiten.