The Amazon Seller Profit Calculator That Reveals True Margins
Amazon profit calculation math on Amazon is trickier than it looks. Our step-by-step guide helps leaders find the real numbers.

Ever wonder what you're actually making on each Amazon sale? An Amazon seller profit calculator is the tool that gives you the real answer. It goes way beyond just looking at your total sales revenue.
Instead, it forces you to account for every single cost—from Amazon’s fees to your ad spend—to show you the true net profit on every single item you sell. This gives you a crystal-clear picture of your financial health, product by product, and turns data into a lever for sustainable scale.
Moving Beyond Revenue To Find Real Profitability
For too many brands, the top-line revenue number is the only metric that matters. When the sales chart goes up, it feels like winning. But that’s a dangerously incomplete story.
High revenue can easily hide shrinking profit margins, turning what looks like a successful business into a ticking time bomb for cash flow. This is where you have to get serious about performance.
The truth is, selling on Amazon involves a complex web of fees and costs that are always changing. Relying on revenue alone is like trying to captain a ship by only looking at the horizon—you're completely ignoring the engine room, your fuel levels, and the slow leaks below deck. You might feel like you're moving forward, but you could be just moments from sinking.
Why Profitability Is Your Strategic Command Center
When you shift your focus from "how much did we sell?" to "how much did we keep?", everything changes. This deep, granular understanding of profitability is the only way to build sustainable growth. It’s not just about accounting; it's about creating a command center for making smarter decisions across your entire business, especially with your ad spend.
An accurate Amazon seller profit calculator helps you do three critical things:
- Identify Your Real Winners and Losers: You can finally see which products are your true profit engines and which ones are just "vanity" bestsellers—they sell a lot but make you little to no money.
- Optimize Your Ad Spend: By linking your PPC campaigns directly to profit, you can ensure every ad dollar is spent on products that can actually afford the advertising and still deliver a healthy return. This transforms PPC from a cost center into a growth lever.
- Sharpen Your Pricing and Inventory Strategy: It gives you the data you need to make smart decisions on pricing, promotions, and how much stock to carry, helping you avoid those killer long-term storage fees on unprofitable items.
By dissecting every single cost, you stop being a reactive seller and start being a proactive brand manager. This is the only way to build a resilient and scalable Amazon business.
At the end of the day, mastering your numbers is about taking back control. While Amazon gives you a massive opportunity, it also presents a thousand different ways for costs to eat away at your bottom line.
For a deeper dive into the basic math, our guide on how to calculate profit margins is a great place to start. This guide will build on those fundamentals, showing you how to apply them inside the Amazon jungle to protect your profits.
Mapping Every Cost For An Accurate Calculation
Your Amazon profit calculator is only as good as the numbers you put into it. It’s that simple. A quick, surface-level calculation that only subtracts the most obvious fees will paint a dangerously optimistic picture of your business's health. To build a tool that gives you real strategic insight, you have to track down every single cost that nibbles away at your revenue.
Think of it like accounting for every ingredient in a recipe. If you forget the salt, spices, or a key binding agent, the final dish just won't work. The same goes for your Amazon business; those "small" costs are the details that separate a profitable product from a dud.
This map gives you a bird's-eye view of how all these pieces fit together.
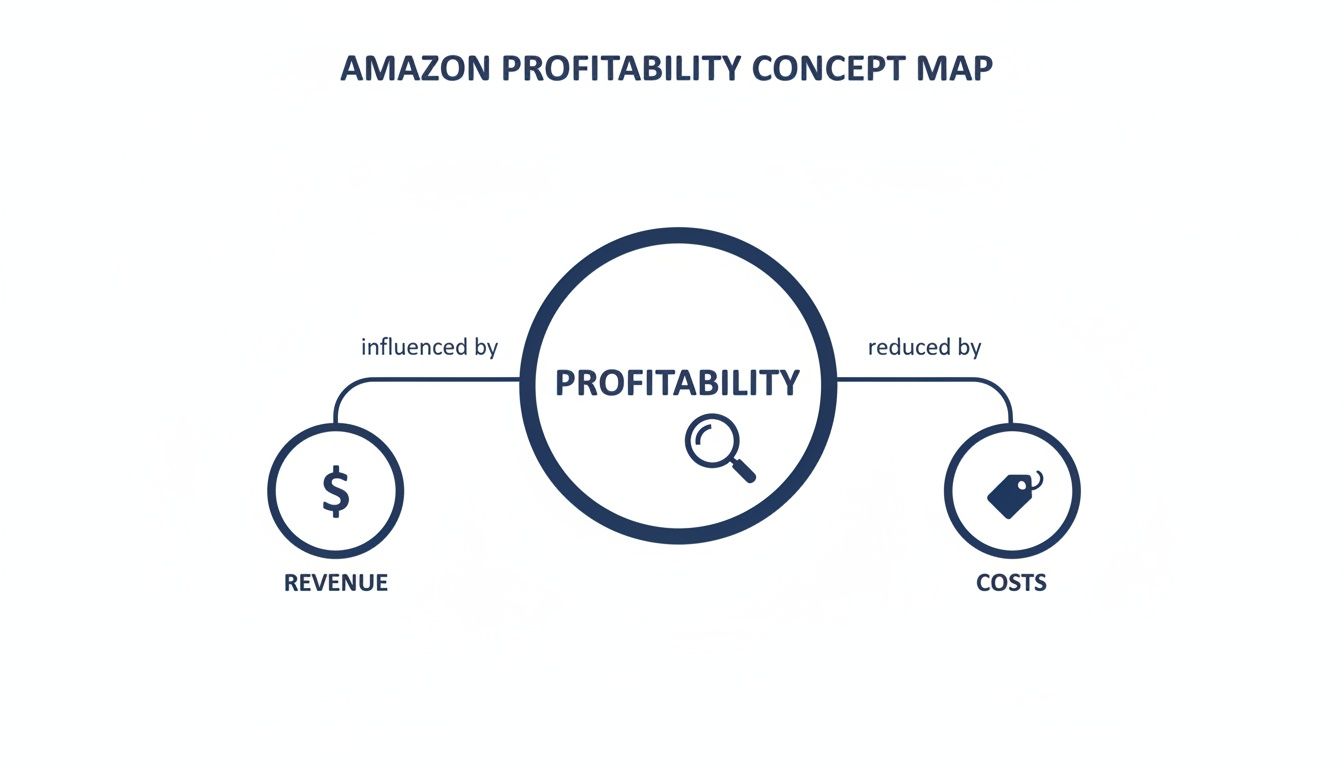
As you can see, revenue is just the starting point. True profit is what’s left after you’ve meticulously chipped away at all the costs.
To get this right, you need a comprehensive checklist of every possible expense. This table breaks down all the inputs your calculator needs, organized by where they come from: the product itself, Amazon's ecosystem, and your own operational overhead.
Essential Inputs for Your Amazon Profit Calculator
A comprehensive checklist of all cost variables required for an accurate profitability analysis, categorized by type (Product, Amazon, Operational).
| Cost Category | Specific Input | Strategic Importance |
|---|---|---|
| Product Costs | Cost of Goods Sold (COGS) | The absolute baseline cost to produce or acquire one unit. |
| Product Costs | Inbound Shipping & Duties | Per-unit cost to get inventory from your supplier to Amazon. |
| Amazon Fees | Referral Fee | The commission Amazon takes on every sale (usually 8-15%). |
| Amazon Fees | FBA Fulfillment Fee | The per-unit cost for Amazon to pick, pack, and ship your item. |
| Amazon Fees | Monthly Storage Fees | Cost to store your inventory in Amazon's warehouses. |
| Amazon Fees | Long-Term Storage Fees | Punitive fees for inventory that sits for too long (over 365 days). |
| Operational Costs | Advertising Spend (PPC) | Your budget for sponsored ads to drive traffic and sales. |
| Operational Costs | Promotional Discounts | The cost of coupons, deals, and other offers you run. |
| Operational Costs | Return-Related Costs | Fees and lost value from customer returns and unsellable units. |
| Operational Costs | Taxes (Sales, Income) | Your estimated tax burden, which impacts true net profit. |
| Operational Costs | Inventory Carrying Costs | The "hidden" cost of capital tied up in your unsold stock. |
Having this full picture prevents nasty surprises down the road and lets you make decisions with confidence, knowing you haven't missed a critical variable that could tank your margins.
The Foundational Costs: Product and Shipping
Long before your product lands in an Amazon fulfillment center, you’re already spending money. These are the core costs that create the foundation for your entire profit calculation.
- Cost of Goods Sold (COGS): This is what you pay your supplier for each unit. It includes manufacturing, materials, and the box it comes in. This is ground zero for any profit analysis.
- Inbound Shipping: This is the cost to get your products from the factory to Amazon's doorstep. It covers everything from ocean freight and customs duties to the final truck delivery. You need to break this down to a per-unit cost for it to be useful.
Forgetting to properly account for inbound shipping is a classic rookie mistake. A product can look incredibly profitable when quoted by the factory, only to become a loss-leader once you factor in the thousands of dollars it costs to ship it across the world.
Navigating Amazon’s Fee Structure
Next up are the fees Amazon charges for the privilege of using its marketplace and fulfillment machine. These are unavoidable and can change based on your product’s category, size, weight, and even the time of year.
- Referral Fees: Think of this as Amazon's commission. For every sale, they take a cut, which is typically between 8% and 15% of the sale price.
- FBA Fulfillment Fees: This is what Amazon charges you to pick, pack, and ship an order to a customer. It’s based on size and weight, so a small, light item might cost around $3.22 while a large, heavy one can easily top $10 or more.
- Inventory Storage Fees: You're renting shelf space in Amazon's warehouses, and they charge you for it by the cubic foot. These fees jump up significantly during the busy fourth quarter (October-December).
A Quick Warning: Long-term storage fees are where profits go to die. If your inventory sits for more than 365 days, Amazon hits you with punishing fees that can completely wipe out your margins on those units. It’s a clear signal that your inventory forecasting is off.
The Often-Overlooked Operational Costs
Finally, we get to the costs that many sellers forget to track or simply miscalculate. These "hidden" expenses are often the reason why the profit you think you're making doesn't match the cash in your bank account.
One of the most important but overlooked metrics is the inventory carrying cost. This isn't just about Amazon's storage fees; it includes the cost of the capital you have tied up in unsold products and the risk that those products will become obsolete before you can sell them.
Other critical costs to track include:
- Promotional Costs: When you run a coupon or a Lightning Deal, that discount comes directly out of your pocket. You have to account for the exact dollar value of every promotion redeemed.
- Return Processing: A return isn't just a sale you lose. Amazon often charges processing fees, the item might be damaged and unsellable, and you never get the original FBA fulfillment fee back. A high return rate can single-handedly sink a product's profitability.
- Taxes: From sales tax to income tax, you have to set aside a portion of your revenue to cover your tax obligations to see your true, take-home profit.
By meticulously tracking every one of these variables, you elevate your calculator from a simple bookkeeping tool into a predictive engine for making smarter, more profitable decisions for your business.
The Hidden Margin Killers: Returns and Ad Spend
You can have your COGS and Amazon fees tracked down to the penny, but two variables can still turn a winning product into a money pit overnight: customer returns and advertising spend.
These aren't just minor deductions. They are active margin killers that demand your constant attention. Ignoring them is the fastest way we've seen brands move a ton of product while making absolutely no money.
Think of your profit margin like a bucket of water. Obvious costs like manufacturing and FBA fees are slow, predictable leaks you can plan for. But returns and out-of-control ad spend? That’s like someone kicking a huge hole in the side of the bucket. Suddenly, your profits are gushing out.

Worse yet, these two costs are often linked. You might crank up your PPC budget to drive more sales, but if that product has a high return rate, you're just paying to accelerate your losses. A proper Amazon seller profit calculator has to treat these as core inputs, not afterthoughts.
Decoding the True Cost of a Return
A customer return is never just a simple refund. The financial hit goes way deeper than the lost sale, kicking off a chain reaction of costs that too many sellers don't fully account for.
When a customer sends something back, you instantly lose:
- The Original Sale Revenue: The most obvious part. That money is gone.
- The FBA Fulfillment Fee: Amazon already picked, packed, and shipped the item. They keep that fee. You don’t get it back.
- Potential Return Processing Fees: Depending on the category, Amazon might ding you with another fee just for handling the return logistics.
Beyond those immediate hits, you're left with the returned unit itself. Best case, it's sellable as new. Often, it's not. This leaves you with a devalued asset you now have to pay to dispose of or try to sell off for pennies on the dollar through liquidation.
Connecting Ad Spend Directly to Profitability
Your PPC strategy can't exist in a bubble, disconnected from your real profit numbers. The most common metric, Advertising Cost of Sale (ACoS), is completely meaningless if you don't know the actual margin of the product you're advertising.
A 25% ACoS might be amazing for a high-margin cosmetic product, but it could be a total disaster for a low-margin kitchen gadget.
This is where Break-Even ACoS becomes your new best friend. It’s the absolute ceiling for your ACoS—the point where you start losing money on every single ad-driven sale.
The formula is simple but incredibly powerful:
Break-Even ACoS = Pre-Ad Profit Margin %
Let's say a product sells for $50. After COGS, all Amazon fees, and factoring in your return rate, you have $15 of profit left over before advertising. That's a 30% pre-ad profit margin.
This means your Break-Even ACoS is also 30%. Any ad campaign for that product running above a 30% ACoS is actively burning your cash.
Analysis from real seller accounts often reveals that returns and PPC together can slash margins by a shocking 20-30%. We saw one case where a brand's supposed "best-seller" was actually losing $0.50 per unit because a 10% return rate and a 25% ACoS weren't being properly calculated against its slim pre-ad margin.
Using ACoS and TACOS for Strategic Growth
While Break-Even ACoS keeps you out of the danger zone, a more advanced metric helps you see the whole battlefield: Total Advertising Cost of Sale (TACOS).
TACOS measures your ad spend against your total revenue (both ad-driven and organic), not just the sales attributed to ads. It's the perfect way to see how your PPC efforts are lifting organic sales and boosting your overall brand presence on Amazon. This is the core of our philosophy: using PPC as a strategic lever for organic growth and total profitability.
When you understand both your break-even ACoS and your TACOS, you can finally use PPC for what it's meant for: sustainable, profitable scale. For a full breakdown, check out our guide on how to calculate TACOS and build it into your Amazon strategy.
By tying every ad dollar back to true, hard-number profitability, you transform advertising from a frustrating expense into a precision tool for scaling your business the right way.
Calculating Your True Profit Per Unit Step By Step
Okay, enough with the theory. It's time to roll up our sleeves and put your Amazon seller profit calculator to work. All those fee structures and abstract concepts only start to click when you apply them to a real product. This is where we turn a pile of data into actual business intelligence, drilling down from a bird's-eye view to a granular, per-unit profit analysis.
Let's walk through a real-world example to make this crystal clear. We'll start with a single product to nail down the process, then I'll show you how this exact model scales across your entire catalog. Think of this as a framework you can lift and shift directly into your own brand's workflow.

The core formula is surprisingly simple but incredibly powerful:
Net Profit = Sale Price - (COGS + All Fees + Ad Spend Per Unit + Return Costs)
This little equation is your north star. It guides every single calculation from here on out. Let's break it down with a realistic scenario.
Single Product Profit Calculation Example
Imagine you sell a premium stainless-steel kitchen gadget. It's a popular item, but you need to know if it's actually making you money after every single cost is scraped off the top. Once you've gathered all your data from Amazon's reports, knowing how to master data parsing in Excel is a game-changer for accurately calculating true profit from those complex data sets.
Here are the numbers for our kitchen gadget:
- Sale Price: $49.99
- Cost of Goods Sold (COGS): $12.50 (This includes manufacturing and shipping to the warehouse)
- Amazon Referral Fee (15%): $7.50
- FBA Fulfillment Fee: $5.06 (Based on its size and weight)
- Monthly Storage Fee (per unit): $0.25
- Ad Spend Per Unit: $4.00 (Calculated by dividing total ad spend by total units sold)
- Return Cost Per Unit: $2.50 (The averaged cost of returns spread across all units sold)
Now, let's just plug these numbers right into our formula.
- Start with the Sale Price: $49.99
- Subtract COGS: $49.99 - $12.50 = $37.49
- Subtract Amazon Fees: $37.49 - ($7.50 + $5.06 + $0.25) = $24.68
- Subtract Ad Spend: $24.68 - $4.00 = $20.68
- Subtract Return Costs: $20.68 - $2.50 = $18.18
The true net profit for each kitchen gadget sold is $18.18. This gives you a net profit margin of 36.4% ($18.18 / $49.99), which is a fantastic figure for this category.
This is the kind of clarity every brand leader needs. Now you know exactly what you're working with. You can set your break-even ACoS with confidence and make smarter decisions about pricing and promotions.
Scaling to a Multi-Product Portfolio
This per-unit calculation is the foundational building block for analyzing your entire business. By simply repeating this process for every SKU, you can quickly sort your products into two critical categories: "heroes" and "zombies."
- Hero Products: These are your high-margin winners. They generate the cash flow that fuels your growth, funds new product ideas, and can handle more aggressive advertising to grab market share. In our example, that kitchen gadget is a true hero.
- Zombie Products: These are the SKUs that are silently draining your resources. They might be selling, but their razor-thin (or even negative) margins mean they're just taking up warehouse space and tying up capital without adding to your bottom line.
Once you've categorized your products this way, you can build a truly profit-driven strategy. You can confidently pump more ad budget into your heroes, knowing every dollar is spent on a profitable foundation. At the same time, you can make the tough but necessary calls on your zombies—either by raising prices, finding a way to slash costs, or cutting them loose altogether. This kind of strategic focus is impossible without doing the math first, one product at a time.
Turning Profit Data Into Smarter Growth Strategies
Knowing your exact profit on every single product isn't just a stuffy bookkeeping task—it's the launchpad for a much smarter, more aggressive growth plan. Once you get past surface-level metrics and know your true margins, you can stop guessing. This is where your Amazon seller profit calculator shifts from a defensive tool that protects your margins into an offensive weapon to capture market share.
The entire dynamic of your business changes. Instead of just chasing revenue, you start building a business around profitability. Every decision, from what you bid on an ad to how much inventory you reorder, becomes sharper and directly tied to your bottom line.
Using SKU-Level Profit to Fuel PPC Performance
Your product-level profit data is the single most powerful tool you can bring to your advertising strategy. Without it, you’re flying blind. You're probably overspending on products with thin margins and underspending on the ones that actually make you money. The goal is to create a direct feedback loop between how profitable a product is and how much you're willing to spend to sell it.
Here’s how to turn those profit insights into a high-performance PPC engine:
- Set Dynamic Bidding Strategies: Give your ad manager the pre-ad profit margin for every SKU. This lets them set precise, profit-driven ACoS targets instead of using a generic, one-size-fits-all goal for your whole account. A product with a 45% margin can easily handle a much more aggressive bid than one scraping by with a 15% margin.
- Focus Spend on "Hero" Products: Figure out which products are your top 10-20% most profitable—these are your "heroes." These are the SKUs that should get the lion's share of your ad budget. Pushing these products harder not only brings in more profit but also boosts their organic ranking, creating a flywheel effect where your ads lift your free, organic sales.
- Create Profit-Tiered Campaigns: Group your campaigns by profit tiers (e.g., High Margin, Medium Margin, Low Margin). This structure makes sure your budget naturally flows toward the products that can actually afford the ad spend and deliver the best return, protecting you from accidentally torching cash on "zombie" SKUs that look good on paper but have no real profit.
This approach completely changes the role of PPC. It's no longer just a sales driver; it becomes a strategic lever for amplifying your most profitable products, directly fueling the growth of your entire business.
A Real-World Example of a Profit-Driven Ad Strategy
High sales numbers can be incredibly misleading, a painful lesson many brands learn the hard way. A common story we see involves a gadget priced at $15 that, after you subtract all the fees, COGS, ad costs, and returns, only generates $0.50 in profit per unit.
One seller we worked with realized this and immediately pivoted their ad spend to a $35 SKU that was kicking out a healthy $9 profit per unit. The result? They doubled their total quarterly profits despite selling fewer units overall. You can dig into more seller case studies about Amazon profit tracking to see how this plays out across different categories.
This example nails the power of reallocation. The brand didn't increase its total ad budget; it just aimed the same firehose of ad spend at a much more profitable target. The result was a dramatic jump in net profit and a much healthier business.
Beyond PPC: Optimizing Pricing and Inventory
The strategic value of your profit data goes way beyond advertising. It gives you the clarity to make smarter, more confident calls on pricing, promotions, and inventory.
Pricing and Bundling Strategies
With precise margin data, you can spot opportunities to adjust prices without killing your sales momentum. For a high-margin product, you might have enough wiggle room to run a deep discount to liquidate aging stock. For a low-margin item, you might realize a small price bump is the only thing that will make it worthwhile.
You can also get creative by bundling low-margin but high-volume items with high-margin accessories. This tactic increases the average order value and boosts the overall profitability of a sale that might otherwise be just so-so.
Data-Backed Inventory Decisions
Inventory is just cash sitting on a shelf, and Amazon’s long-term storage fees are the penalty for poor planning. Your profit calculator gives you the data to make ruthless decisions.
- Prioritize Restocks: Make sure your most profitable "hero" products never go out of stock. Every lost sale on these items is a significant hit to your bottom line.
- Cut the Zombies: For products with razor-thin or even negative margins, be aggressive about liquidating them. The cost of long-term storage will almost certainly wipe out any potential profit. It's better to cut your losses and reinvest that capital into your winners.
By weaving SKU-level profitability into every part of your operation, you build a resilient, efficient, and scalable brand on Amazon.
Headline Takeaway: Your Amazon seller profit calculator is your strategic command center. Use its data not just to measure what happened in the past, but to actively shape your future growth. By aligning your PPC, pricing, and inventory strategies with your true profit margins, you create a system where every action is optimized to build a stronger, more profitable business.
Common Pitfalls To Avoid In Profit Tracking
Even the best Amazon profit calculator is only as good as the data you feed it. Building the tool is step one, but keeping it accurate is an ongoing battle. Too many brands set it up once and forget it, which is a recipe for misleading numbers.
The Amazon marketplace is always in motion, and your calculations have to keep up. One of the most common—and costly—mistakes is using outdated fee structures. Amazon changes its FBA and referral fees all the time. If you don't update your calculator the moment they do, your margins will be off, leading to bad pricing and ad spend decisions for months.
Ignoring The Hidden Drains
Then there are the "hidden" costs, the little leaks that can sink your profitability over time. These don't show up neatly on every transaction report, so it's easy to overlook them completely.
- Inbound Shipping: Are you truly averaging the cost of freight, customs, and duties into each unit's cost? If not, your COGS are artificially low, and your profit picture is far too rosy.
- Disposal and Removal Fees: Liquidating dead stock isn't free. Those fees have to be accounted for somewhere, and they absolutely impact your overall profitability.
- The True Cost of Returns: Most sellers just track the lost sale from a return. They forget about the non-refundable FBA fees, the return processing costs, and the fact that the returned unit is often damaged and unsellable.
Finally, one of the most dangerous traps is relying only on high-level metrics like TACOS. A healthy-looking TACOS can easily mask the reality that your ad spend is propping up products with razor-thin (or even negative) margins.
The biggest pitfall of all is complacency. Accurate profit tracking isn’t a task; it’s a discipline. Think of it as a continuous audit of your business, demanding constant vigilance to ensure every decision is based on data that's current, complete, and correct.
Frequently Asked Questions
Let's tackle some of the most common questions we hear from brand owners and ad managers about tracking Amazon profitability.
How Often Should I Be Running These Numbers?
Think of your profit calculator as a living document, not a one-and-done spreadsheet. You can't just set it and forget it. As a baseline, you should do a full, deep-dive profitability review at least monthly, lining it up with your regular financial reporting cycle.
That said, you need to update your calculator immediately any time a major cost changes. The big one to watch for is Amazon's FBA and referral fee updates, which they usually roll out a few times a year. If you don't adjust your numbers the day those changes go live, your profit data will be wrong overnight.
What’s a Good Net Profit Margin to Aim For?
There's no single magic number, but for most private label brands on Amazon, a healthy net profit margin lands somewhere between 15% and 25%. Of course, this can swing wildly depending on your category. A brand selling competitive electronics might have to live with thinner margins, while one with a unique, branded grocery item could easily clear that range.
The most important benchmark isn't some industry average; it's your own goal. A brand in a heavy growth phase might be perfectly happy with a 10% margin if it means grabbing market share. A more established brand, on the other hand, might be shooting for 30% or more on its core products.
Can’t I Just Use Amazon’s Revenue Calculator for This?
Amazon's official FBA Revenue Calculator is a decent tool for a quick, back-of-the-napkin estimate. But it is absolutely not a replacement for a real profit calculator.
Its biggest blind spot? It doesn’t account for your business-specific costs that change all the time, like your ad spend, return rates, or inbound shipping fees. Relying on it alone gives you a dangerously rosy view of your finances. For making smart decisions on things like PPC budgets and inventory orders, you need the full picture—and that means including every single cost.
At Headline Marketing Agency, we don't just manage ads; we connect them directly to your profit data. We move past basic ACoS goals to build advertising strategies that pour fuel on your most profitable products, driving real growth that shows up on your bottom line.
Ready to make your advertising a true profit center? Schedule a consultation with our Amazon experts today.
Get Your Free Amazon PPC Audit
Discover untapped growth opportunities and see how our data-driven approach can improve your ROAS.
Get Free Audit →Ready to Transform Your Amazon PPC Performance?
Get a comprehensive audit of your Amazon PPC campaigns and discover untapped growth opportunities.