Build Amazon Pay Per Click Reports That Drive Profitability and Scale
Most sellers track the wrong Amazon PPC reports. Our approach focuses on the numbers that actually drive profit and growth.
Your pay-per-click reports are more than a scorecard—they're the strategic blueprint for the true health and profitability of your Amazon advertising. A performance-first report cuts through vanity metrics to expose wasted ad spend, diagnose underperforming campaigns, and unlock opportunities to grow both paid and organic sales. It's the key to using PPC as a lever for sustainable, long-term growth.
Why Your Default Amazon Pay Per Click Reports Are Costing You Money
If your reporting strategy on Amazon begins and ends with checking your Advertising Cost of Sale (ACOS), you're navigating with a massive blind spot. Many brands simply download the standard reports from Seller Central, glance at the familiar numbers, and move on. This approach isn't just passive—it's actively costing you money.
This habit masks deeper issues quietly eroding your profits. A campaign might boast a "good" ACOS, creating a false sense of security. But what that basic report won't reveal is if your paid clicks are merely cannibalizing sales that would have happened organically anyway. For established products, this is one of the biggest—and most common—profit killers on the platform.
The Problem with Surface-Level Reporting
Relying on default dashboards traps you in a cycle of reactive, often unprofitable, decisions. Tracking only top-line metrics means you're missing the strategic context—the "why"—behind the numbers. This flawed approach inevitably leads to several critical business problems:
- Hidden Wasted Spend: You continue to fund keywords or entire campaigns that generate clicks but fail to contribute to your bottom line or total business growth.
- Missed Organic Opportunities: You can't see how ad spend impacts your organic rankings, effectively ignoring one of the most powerful growth levers for building long-term brand equity on Amazon.
- Unprofitable Scaling: You increase budgets based on vanity metrics, leading to higher ad costs without a corresponding increase in total sales or overall profit margin.
The goal isn't just a lower ACOS; it's to wield paid advertising as a strategic tool. For a deeper dive into this key metric, you can learn more about what ACOS means and its role in a holistic strategy. The real power is unlocked when you use your pay per click reports to create a flywheel effect: your ads boost organic visibility, which in turn builds sustainable, long-term market share.
A report that doesn't connect ad spend to total sales growth is just a record of expenses. True performance analysis measures the impact of those expenses on your entire Amazon business, not just the ad-attributed sales.
Adopting a Profit-Driven Mindset
For eCommerce leaders who know that vanity metrics don't pay the bills, it's time for a mental shift. Your reports must answer strategic business questions, not just tactical advertising ones.
Instead of asking, "What's my ACOS?" you should be asking, "How is my ad spend impacting my Total ACOS (TACOS)?" or "Is this campaign acquiring genuinely new customers, or am I just paying to convert existing brand loyalists?"
This is the mindset that separates brands treading water from those who dominate their category. It’s about evolving your reporting from a simple scorecard into a sophisticated, profit-driven diagnostic tool. Your reports should tell a story about where your business is headed, not just where it’s been. Once you start digging deeper, you can finally stop guessing and start making data-backed decisions that drive real, measurable profit.
Building Your Foundational PPC Reporting Template
To drive profitable growth, you cannot rely on the scattered views within the Amazon Advertising console. Trusting the default interface is like trying to navigate a ship by watching individual waves instead of reading the entire ocean. The first, most critical step is to build a single source of truth—a foundational template where you merge, clean, and structure raw data for genuine strategic analysis.
This means pulling specific reports from Seller Central and consolidating them into one master view. This isn't about replicating what Amazon shows you; it's about connecting the dots between your ad spend, the keywords you're bidding on, and the actual products customers are buying. This consolidated view is the bedrock for calculating the advanced metrics that reveal the true story of your performance.
Relying on default reports alone is a recipe for missed opportunities and wasted ad spend. You end up reacting to problems instead of preventing them.
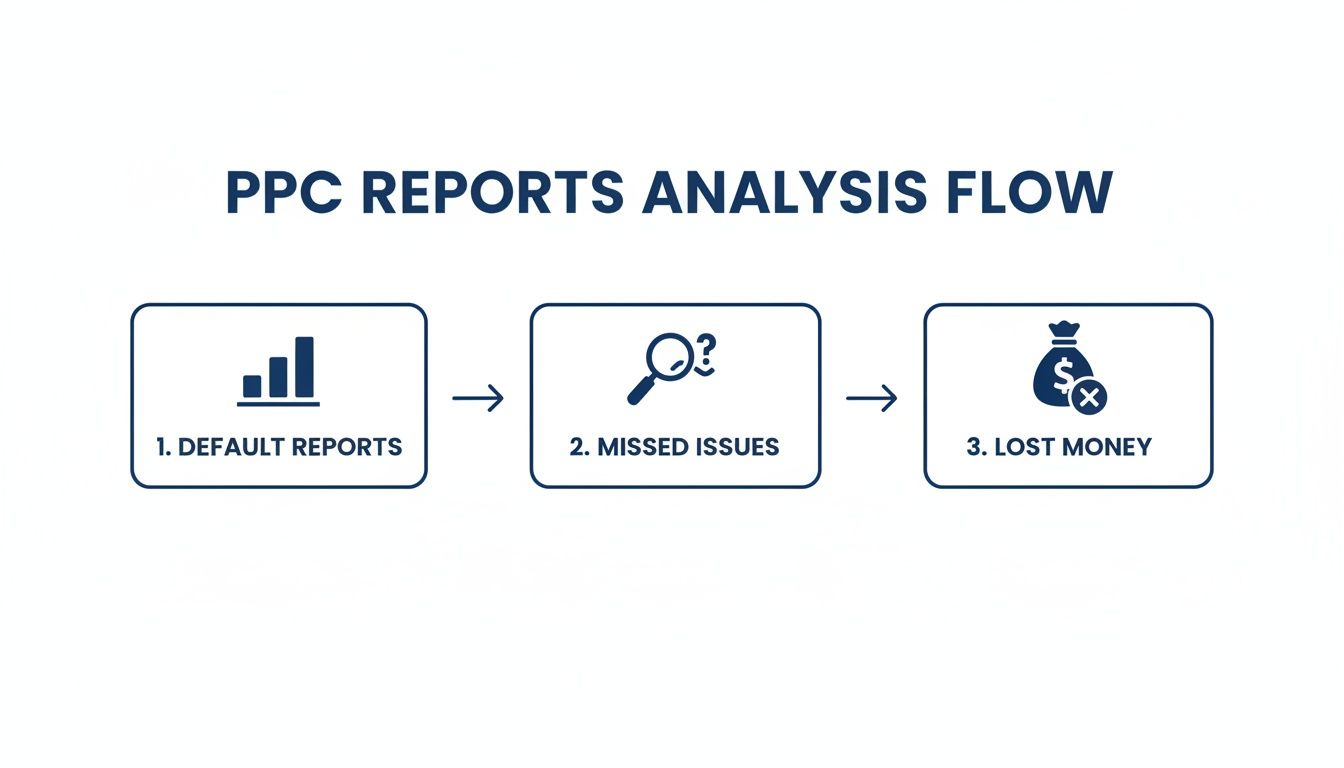
This flow drives home a key point: without a custom-built, comprehensive template, you’re operating with a partial picture. That leaves your brand exposed to inefficiencies that silently drain your budget.
Gathering the Right Raw Data
Your custom PPC reports are only as valuable as the data you feed them. To get the full story, you need to regularly download and combine a few key reports from the Advertising Reports section in Seller Central.
For a robust foundation, ensure you're pulling these files:
- Sponsored Products Search Term Report: This is your ground truth. It reveals the exact search terms customers used before clicking your ad, allowing you to separate high-performing terms from budget-draining ones.
- Sponsored Products Purchased Product Report: This report is gold for understanding "halo" sales. It connects an ad click on one of your products to the specific ASINs that were ultimately purchased. For example, a customer clicks an ad for a red shirt but buys the blue version—this report captures that critical data.
- Sponsored Brands Keyword Report: Essential for brands running top-of-funnel campaigns. It provides keyword-level performance for Sponsored Brands, which often carry different strategic goals than bottom-of-funnel Sponsored Products ads.
We recommend a weekly pull cadence. The objective is to build a repeatable, consistent process that becomes the heartbeat of your Amazon operations.
Structuring Your Master Reporting Template
Once you have the raw data, merge it into a single spreadsheet (like Google Sheets or Excel) or a data tool. The goal is a master view where each row represents a unique combination of a campaign, ad group, and customer search term. Functions like VLOOKUP or INDEX/MATCH are typically used to consolidate everything into one cohesive table.
Your template must be built to answer fundamental business questions. To properly diagnose campaign performance, you have to build a pay per click report that tells a clear, concise story. This unified view lets you see precisely how much you spent on a keyword and which product sales resulted from that spend. It’s the mandatory first step to moving beyond surface-level metrics.
Expert Insight: A well-structured template doesn't just display data; it organizes it for decision-making. The goal is to easily filter by campaign, see keyword-level profitability, and connect ad spend directly to product-level sales. This is where real insights are born.
Once your data is structured, add calculated columns for your core metrics. This is where you lay the groundwork for deeper analysis. For instance, you can now calculate ACoS at the search term level, not just the campaign level, giving you far more granular control over your optimizations. This clean, organized data set is your launchpad for shifting from reactive PPC management to proactive, strategic growth.
Key Metrics For Your Foundational PPC Report
Before you can spot trends or make optimizations, you need the right metrics front and center. Here’s a breakdown of the essential metrics to include in your custom report and what each one really tells you about your campaigns.
| Metric | What It Measures | Why It Matters For Amazon Brands |
|---|---|---|
| Impressions | The total number of times your ad was displayed on a search results page. | Shows brand visibility and reach. Low impressions may indicate issues with your bid, budget, or keyword relevance. |
| Clicks | The number of times shoppers clicked on your ad after seeing it. | Indicates how compelling your ad creative (image, title, reviews) is to your target audience. |
| CTR (Click-Through Rate) | The percentage of impressions that resulted in a click (Clicks ÷ Impressions). | A direct measure of ad relevance. A high CTR means your ad resonates with the search query. |
| Spend | The total cost of all clicks on your ad over a specific period. | Your direct investment. This is the "cost" part of your profitability equations and must be tracked carefully. |
| Orders | The number of orders placed by shoppers within 7 days of clicking your ad. | The ultimate goal of most campaigns. This metric confirms that your ads are driving actual purchase behavior. |
| Sales | The total product sales generated from attributed orders. | Measures the direct revenue driven by your ad spend, forming the basis for your ROI calculations. |
| ACOS (Advertising Cost of Sale) | The percentage of sales spent on advertising (Spend ÷ Sales). | The go-to efficiency metric. It tells you how much you spent on ads for every dollar of revenue you earned. |
| ROAS (Return on Ad Spend) | The amount of revenue generated for every dollar spent on advertising (Sales ÷ Spend). | A measure of profitability. A ROAS of 5 means you earned $5 for every $1 you spent on ads. |
Including these core metrics in your foundational report gives you a powerful, at-a-glance dashboard. From here, you can start layering in more advanced calculations to uncover deeper insights and make smarter decisions for your business.
It’s Time to Look Beyond ACOS
For years, the Amazon advertising world has been obsessed with ACOS (Advertising Cost of Sale). While it’s a useful measure of campaign efficiency, treating it as the ultimate arbiter of success is a strategic error.
A low ACOS doesn’t automatically mean you're profitable, and a high ACOS doesn't always signal a failing campaign. Sophisticated brand leaders know they must look past this single data point to see the bigger picture—how ad spend is actually impacting the entire business.
Relying solely on ACOS is like judging a quarterback only on their completion percentage. It’s an important stat, but it ignores touchdowns, total yards, and whether the team actually won the game. Your pay per click reports need to measure the win, not just the individual plays. This means shifting your focus to metrics that link ad performance to total revenue, organic growth, and long-term profitability.
Unlocking the Flywheel with TACOS
If you track only one strategic metric, make it Total Advertising Cost of Sale (TACOS). This is where you see the real impact of your investment—the powerful connection between your advertising and your organic sales, often called the PPC flywheel.
Unlike ACOS, which just compares ad spend to ad revenue, TACOS measures your ad spend against your total business revenue.
TACOS = Total Ad Spend ÷ Total Revenue
A consistently decreasing TACOS is the number one indicator of a healthy, scaling brand. It proves your ads are doing more than generating immediate sales; they're boosting your organic rank and driving more non-paid sales over time. This creates a powerful growth loop where you can reinvest profits to capture even more market share. To get a deeper dive, you can learn more about how to calculate and use TACOS for your brand.
Here’s a real-world example of this principle in action:
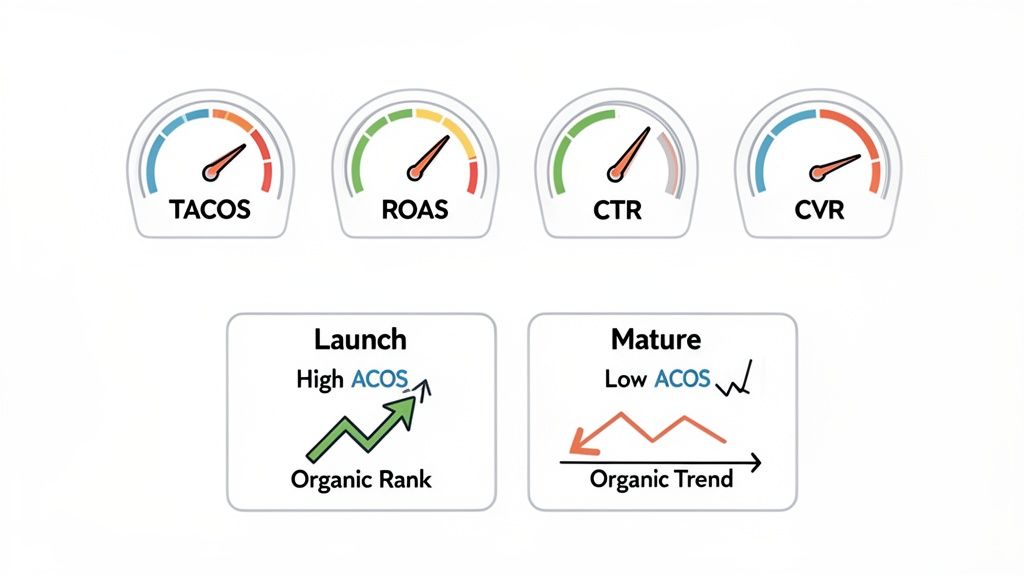
- An Amazon brand in the competitive home goods space launched a new product and ran ads at a 100% ACOS for the first month. An ACOS-only report would label this a catastrophic failure. However, those ads drove enough sales velocity to push the product onto page one for its primary keywords, resulting in a 20% TACOS. The campaign was a massive strategic win—they effectively purchased their organic ranking, setting the stage for long-term, profitable growth.
ROAS: Your Profitability North Star
While ACOS is a percentage-based efficiency metric, Return on Ad Spend (ROAS) frames performance as a direct multiplier. It answers the simple, crucial question every business leader asks: "For every dollar I put into ads, how many dollars do I get back?"
ROAS = Total Ad Revenue ÷ Total Ad Spend
A ROAS of 4.0 means you generated $4 in ad revenue for every $1 spent. This format is far more intuitive for financial planning. You can set a break-even ROAS based on your product margins, knowing that anything above that threshold is pure profit. It shifts the entire conversation from cost-cutting to profit-building.
Your goal isn't just to be efficient; it's to be profitable. ROAS keeps the focus squarely on the return, forcing a healthier perspective on your ad investment and its direct contribution to the bottom line.
Using CTR and CVR as Your Diagnostic Tools
If TACOS and ROAS are your strategic compass, think of Click-Through Rate (CTR) and Conversion Rate (CVR) as your diagnostic tools. They help you pinpoint why your campaigns are working—or why they aren't.
Click-Through Rate (CTR): This measures ad relevance. A low CTR is a red flag indicating a disconnect between your keyword, your ad creative (image, title), and customer intent. Your ad simply isn't compelling enough to earn the click.
Conversion Rate (CVR): This measures your product page's effectiveness. High CTR but low CVR is a classic problem: you’re driving the right traffic, but they aren't converting. The issue lies on your detail page—poor copy, bad reviews, uncompetitive pricing, or low stock.
Imagine a campaign for a mature product is running at a fantastic 15% ACOS, but you notice your TACOS is creeping up. You dig into the data and find that while the ads convert well, they're primarily targeting your own brand name. That "efficient" campaign is just cannibalizing sales you would have gotten organically anyway, slowly degrading your overall business health.
By moving beyond ACOS, you transform your pay-per-click reports from a simple expense sheet into a strategic roadmap for growth. This is how top brands win on Amazon—by measuring what truly matters.
Integrating Advanced Data For A Competitive Edge
The PPC reports we’ve built so far are excellent for looking in the rearview mirror. They tell you what happened, enabling performance tracking and efficiency management. But to truly outmaneuver the competition, leaders must ask the next, more important question: why did it happen, and what is our next strategic move?
This is where we graduate from standard metrics to advanced analytics. By integrating data from tools like the Search Query Performance (SQP) dashboard and Amazon Marketing Cloud (AMC), your reports evolve from a simple scorecard into a formidable strategic weapon. This is how you start predicting market shifts instead of just reacting to them.
Tying PPC Performance to Organic Health with SQP
The Search Query Performance dashboard is one of the most powerful—and most underutilized—tools in Amazon's ecosystem. It provides a transparent view of your brand’s performance across both paid and organic search for top keywords, showing impression share, click share, and even sales share.
When you layer SQP data into your reporting, you can finally answer the million-dollar question for long-term growth: Is my PPC spend generating incremental sales and improving my organic rank?
This is where you connect the dots. You can pinpoint where your ads are plugging a visibility gap for keywords you don’t yet rank for organically. More importantly, you can spot where you’re wasting money on keywords where you already own the top organic spot—a classic case of sales cannibalization.
Consider this real-world scenario:
- Your SQP report shows your brand commands a 70% organic impression share for the search term "bamboo cutting board."
- Simultaneously, your PPC report reveals that your campaigns are allocating a significant portion of their budget to that exact-match keyword.
This insight is an immediate action signal. It’s a clear directive to reallocate that budget from a defensive posture to an offensive one. You can shift spend to target competitor keywords or broader, top-of-funnel terms where your organic footprint is much smaller.
Your pay per click reports become infinitely more valuable when they stop treating paid and organic performance as separate channels. SQP data is the bridge that connects them, revealing the true incremental impact of your ad dollars on your total market share.
Uncovering the Full Customer Journey with AMC
While SQP illuminates the interplay between paid and organic search, Amazon Marketing Cloud (AMC) helps you map the entire, non-linear customer journey. Standard attribution in Seller Central is simplistic, typically crediting only the last ad a shopper clicked. We know that’s not how people actually shop.
AMC allows you to see the complete narrative. You can analyze every ad exposure across the funnel—from the first Sponsored Display ad a shopper saw to the Sponsored Brands Video they watched days later. It helps you understand how different ad formats work in concert to guide a customer toward a purchase.
With AMC, you can finally answer questions that are impossible to tackle with standard reports:
- How many customers who saw a Sponsored Display ad later returned and converted through a branded search campaign?
- What is the average time between a customer’s first ad interaction and their eventual purchase?
- Are video ads more effective at acquiring new-to-brand customers than our static Sponsored Brands ads?
This level of detail is non-negotiable in today's crowded market. The global paid search ad market has exploded to $351.5 billion in spending, and with Amazon claiming a huge 22.3% share of U.S. search ad revenue, it’s an incredibly competitive battlefield. You can explore more benchmarks to see just how crucial this kind of specialized PPC expertise has become.
From Data Points to Strategic Imperatives
Integrating SQP and AMC data elevates your reporting from day-to-day tactical adjustments to high-level strategic planning. For any eCommerce leader, this shift is fundamental.
You move beyond simply tweaking keyword bids to making fully informed decisions about capital allocation across your entire product portfolio. You can defend market share more effectively because you know precisely where competitors are gaining an edge, allowing you to deploy ad spend with surgical precision.
This advanced approach reveals how your Amazon advertising fits into your company's broader marketing ecosystem. It provides the data you need to build a brand that is not just profitable, but resilient and scalable. The takeaway is clear: the brands that win on Amazon are those that look beyond default reports and embrace a complete view of performance. This is how you turn data into dominance.
Turning PPC Report Insights Into Actionable Optimizations
A sophisticated report is worthless if it doesn't drive action. Its real value is realized when you convert data points into smarter, faster decisions that grow your business. This is where strategy meets execution—translating what you see in your pay-per-click reports into tangible campaign optimizations.
This is not abstract theory; it's a practical playbook. The goal is to stop merely observing performance and start actively shaping it, using your report as a direct guide for refining bids, reallocating budgets, and driving sustainable growth.
From Data Points to Direct Actions
Think of your comprehensive report as a strategic map. It highlights exactly where your capital is working hardest and, more importantly, where it's being wasted. Let's walk through common scenarios and the precise actions required.
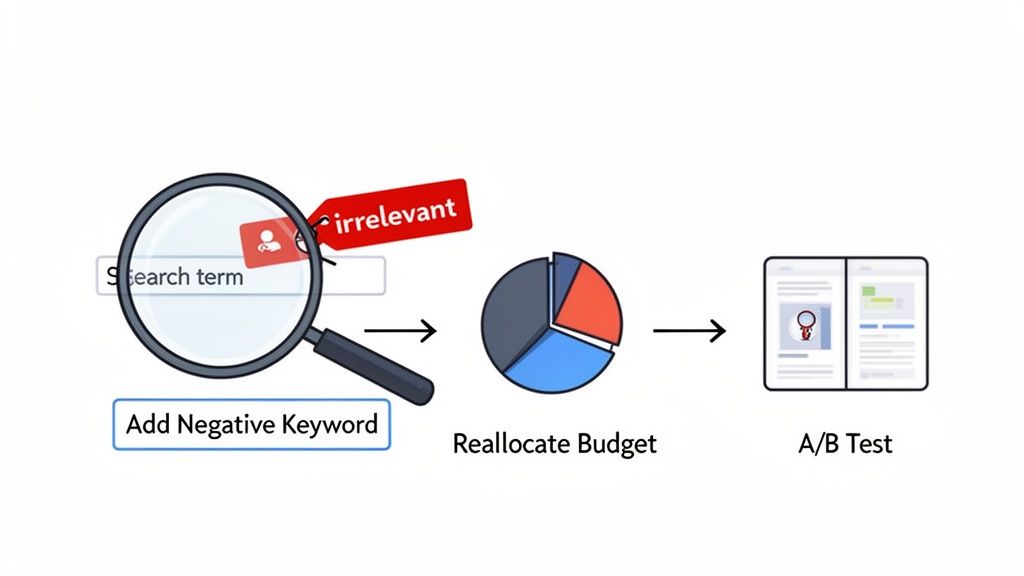
Scenario 1: High Spend on Irrelevant Search Terms You filter your Search Term Report by spend and discover you’ve burned $500 on clicks for "iPhone 15 case," but you sell premium leather wallets. This is a classic budget leak, typically caused by broad or phrase match keywords casting too wide a net.
- Your Action: Immediately add "iPhone 15 case" as a negative exact match keyword to the corresponding ad group. If this is a recurring issue, consider adding broader terms like "case" or "screen protector" as negative phrase matches. This action instantly stops the financial bleeding and redirects that budget toward traffic that can actually convert.
Scenario 2: Low CTR on a High-Impression Keyword Your report shows one of your top keywords is generating thousands of impressions, but its click-through rate is a dismal 0.2%. The audience is seeing your ad, but they are not compelled to click.
- Your Action: This is a clear signal to A/B test your creative. Do not adjust the keyword yet. Initiate a test of a new main image or a more benefit-driven headline. For instance, instead of "Premium Leather Wallet," test "The Last Wallet You'll Ever Need." A low CTR is a direct indictment of the ad's appeal, not necessarily the keyword targeting.
Refining Your Bidding and Budget Allocation
Smart budget management is not about spending less; it's about spending smarter. Your report is your primary tool for reallocating capital from underperforming assets to high-growth opportunities.
This has never been more critical. The cost per click (CPC) across major platforms has surged. Recent analyses show Google Search CPCs jumping 45% and Meta CPCs climbing 64%. With 86% of industries facing higher costs, campaign efficiency is no longer a best practice—it's essential for survival. You can read more about these troubling PPC trends and their implications for advertisers.
This competitive pressure makes every dollar count.
A dollar misspent on an irrelevant keyword is a dollar you can't invest in a high-ROAS campaign. Your report should empower you to make these trade-offs with confidence, shifting funds from waste to growth every single week.
Scenario 3: A Downward-Trending TACOS You're reviewing your dashboard and see that while your ACOS has remained stable at 30%, your TACOS has dropped from 15% to 10% over the last quarter. This is a clear sign of success. It's definitive proof that your ads are successfully boosting your organic rank and lifting total sales.
- Your Action: This is not the time to coast. This is a signal to strategically increase your advertising budget. Your ads are creating a powerful flywheel effect. Now is the time to press your advantage, perhaps by targeting more top-of-funnel keywords to introduce the brand to new customers and accelerate your organic dominance even further.
Using Reports to Fuel Your Testing Pipeline
Your pay-per-click reports are a goldmine of A/B testing ideas. By analyzing CTR and CVR at a granular level, you can build data-backed hypotheses to improve performance across the board.
| Report Insight | Data-Backed Hypothesis | A/B Test to Run |
|---|---|---|
| High CTR, Low CVR | The ad is relevant and compelling, but the product detail page isn't closing the sale. | Test a new main image, update bullet points to address customer questions, or add A+ Content. |
| Low CTR, High CVR | The product page is highly effective, but the ad isn't attracting enough qualified clicks. | Test a new ad headline that highlights the main benefit shown to convert well on the page. |
| Strong Performance on Mobile | Mobile shoppers are a key high-converting segment for this product. | Create a mobile-specific campaign with shorter, punchier headlines and thumb-stopping images. |
This systematic approach turns reporting from a passive chore into an active, iterative process of improvement. Each insight leads to a test, and each test generates new data. This creates a continuous loop of optimization that drives long-term, profitable growth. This is how you transform data into marketplace dominance.
Making Your Reporting Effortless with Automation
You’ve built a robust, data-driven report. That's a huge win. But if you’re still manually wrestling with spreadsheets every week, you've created a new problem: the reporting process itself is the bottleneck. The real game-changer is moving from a manual grind to a streamlined, automated system. This is how you scale an advertising operation without increasing headcount.
Automating your PPC reports liberates your team from low-value tasks. No more mind-numbing hours spent downloading, cleaning, and consolidating data. This doesn’t just reclaim time; it dramatically reduces the human errors that can contaminate manual reports and lead to poor decisions. The goal is to spend your time analyzing the strategic narrative in the data, not just gathering the raw inputs.
From Manual Labor to Strategic Command
The transition begins by connecting Amazon's Advertising API to a data visualization tool like Google Data Studio, Tableau, or a specialized eCommerce intelligence platform. This creates a live dashboard that automatically ingests performance data, giving you a real-time pulse on your campaigns.
To build for the long term, leaders must investigate real-time business intelligence and automated reporting. This means you can identify trends and remediate issues the moment they arise, rather than discovering them in a report a week later when the damage is done.
Consider this: mobile ad spend is projected to account for 66% of all digital ad spending. An automated dashboard can instantly flag if your mobile performance is deteriorating compared to desktop. That’s an insight you can act on today, not next week.
The Real Payoff of an Automated System
The power of automation is not just about saving time—it’s about enabling faster, smarter strategic decisions. When your team is not bogged down in data preparation, they can focus on the high-level questions that drive growth.
- Solve problems before they escalate: A sudden CPC spike or a drop in conversion rate? Address it immediately.
- Allocate budget with confidence: Reallocate ad spend to winning campaigns in real time, without waiting for the next reporting cycle.
- Go deeper with your analysis: With the basics automated, your team has the bandwidth for advanced analysis, like modeling customer lifetime value or path-to-purchase.
The purpose of automation is to transform reporting from a backward-looking chore into a forward-looking strategic asset. It allows you to apply your expertise where it matters most: making the smart decisions that increase profit and scale your brand.
If you're ready to make this leap, various tools can facilitate it. You can check out our guide on PPC software for Amazon to explore options that fit your business needs. Ultimately, winning on Amazon requires pairing expert strategy with intelligent automation.
At Headline Marketing Agency, we build data-driven reporting systems that connect ad spend directly to your bottom line. We blend hands-on expertise with intelligent automation to deliver the strategic insights you need to lead your category and drive profitable growth. Let's build your growth strategy.
Get Your Free Amazon PPC Audit
Discover untapped growth opportunities and see how our data-driven approach can improve your ROAS.
Get Free Audit →Wollen Sie Ihre Amazon PPC-Performance aufs nächste Level bringen?
Lassen Sie Ihre Amazon PPC-Kampagnen professionell analysieren und entdecken Sie neue Wachstumsmöglichkeiten.