Unlocking Growth: How to Calculate Profit Per Unit the Right Way
What most sellers miss about Unlocking Growth — and the approach that consistently delivers.

Calculating profit per unit seems simple: sale price minus cost. But for ambitious Amazon brands, this basic formula is a minefield of overlooked expenses and flawed assumptions that silently bleed your business dry, rendering your ad spend completely ineffective.
Getting this number right isn't just an accounting exercise. It's the bedrock of sustainable scale on Amazon.
Why Profit Per Unit Is a Leader's Most Critical Metric
High-level revenue figures are vanity. E-commerce leaders know the real game is won or lost in the granular details of unit economics.
A deep, precise understanding of the profit you generate on every single item is the only way to make intelligent decisions on pricing, inventory, and, most critically, your advertising strategy. Without it, you're flying blind, making budget decisions based on gut feel instead of data.
For Amazon brands, this one metric is the central lever for strategic growth. Knowing your precise profit per unit allows you to wield PPC not just as a tool for immediate sales, but as a calculated investment to boost organic rank and long-term enterprise value. That's a performance-driven strategy that's impossible if you don't know your numbers cold.
The Foundation of Smart Decision-Making
At its core, the basic formula is straightforward: Profit per Unit = (Selling Price per Unit) - (Cost per Unit). The "cost" part must include all variable costs and, for a truly complete picture, a portion of fixed costs. A product selling for $50 with a total unit cost of $30 yields a $20 profit per unit—the essential number for any strategic planning.
Of course, a high-level view isn't everything. For a more complete picture of your financial health, it's also worth understanding other key sales KPIs that fill in the gaps.
For Amazon brands, profit per unit isn't just a financial metric—it's your primary strategic tool. It dictates your advertising ceiling, informs your pricing floor, and ultimately determines whether you can scale profitably or are simply buying revenue at a loss.
Moving Beyond Simple Calculations
The real challenge for Amazon sellers isn’t the formula itself. It’s accurately identifying every single cost that chips away at your margin. Many brands stop at COGS and FBA fees, leaving a pile of critical expenses unaccounted for.
This leads to costly, unforced errors:
- Overspending on Ads: Setting ACOS or ROAS targets that your unit economics can't actually support. For example, a CPG brand we audited was targeting a 35% ACOS on a product that only had a 28% pre-ad contribution margin, losing money on every ad-driven sale without realizing it.
- Unprofitable Promotions: Running discounts that push a popular product into the red.
- Scaling Losers: Pouring ad budget and resources into a "best-selling" SKU that is secretly unprofitable on a per-unit basis.
Mastering how to calculate profit per unit accurately transforms your entire approach. You shift from reactive to proactive, ensuring every dollar spent on advertising is a true investment with a clear, profitable return.
Finding Your True Cost Per Unit (It’s Not Just COGS)
If you're only looking at your factory invoice to figure out product costs, you're operating with a critical blind spot. Relying on just the Cost of Goods Sold (COGS) is one of the quickest ways to erode profitability, especially when you factor in ad spend. To get a real, actionable number, you must map the entire financial journey of a single unit.
This means a full breakdown of every cost—large and small—that quietly chips away at your margins. We're going to dig past the obvious manufacturing costs and standard FBA fees to uncover the hidden expenses many sellers fail to track. Think of it as creating a financial x-ray of your product.
Getting this right is the foundation of intelligent e-commerce management, allowing you to see exactly where your capital is allocated on a per-unit basis.
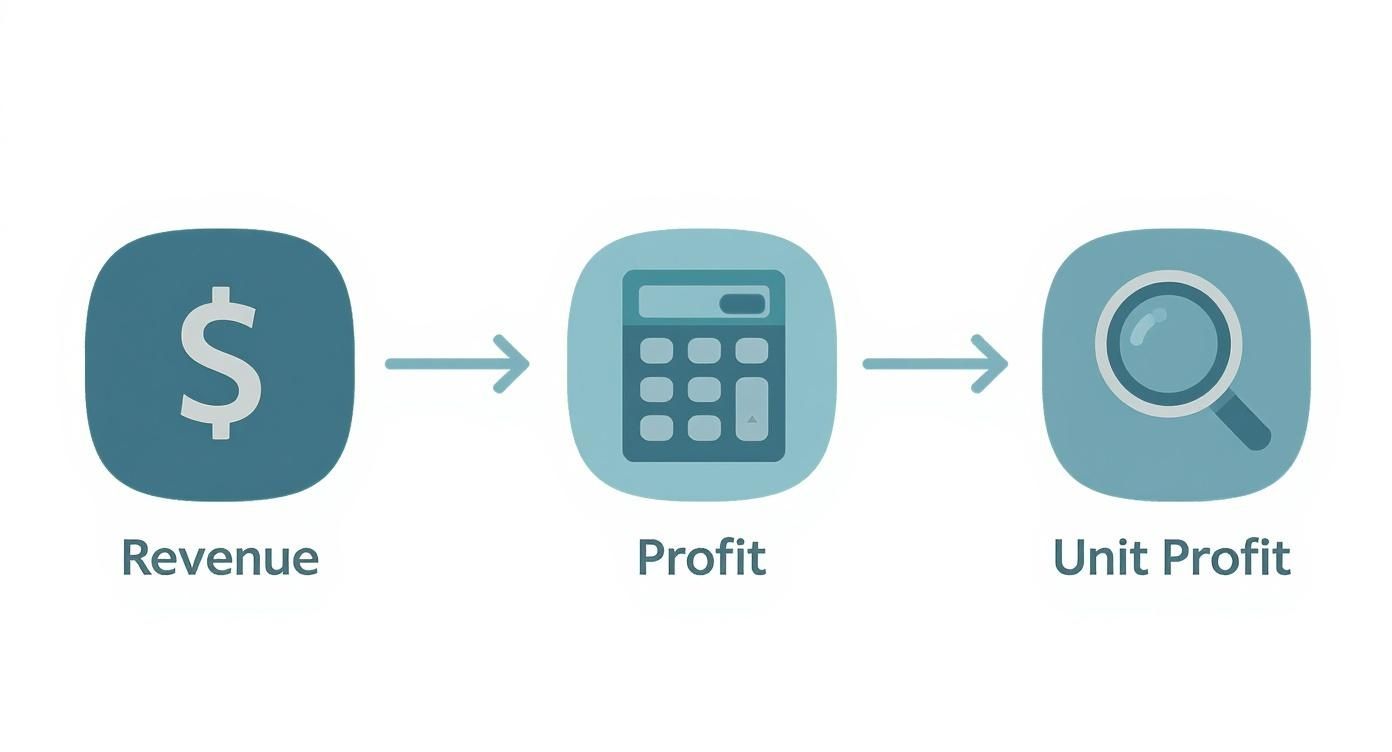
This flow shows why zooming in on your unit economics is so critical. It’s where you make the decisions that actually move the needle.
Start with Your Landed Cost
The first layer to add on top of your manufacturing cost is the landed cost. This is the all-in price to get one unit from the factory floor and checked into an Amazon fulfillment center, ready to sell. It’s always significantly higher than your supplier invoice.
Here’s what goes into your landed cost:
- Manufacturing Cost: The per-unit price from your supplier.
- Inbound Freight & Shipping: The cost to move inventory from the factory to its destination port or warehouse. This can swing wildly depending on the season and shipping method.
- Duties, Tariffs & Taxes: Import fees charged by customs. These can be a major unexpected expense if you don't know the HTS codes for your product category.
- Customs Brokerage Fees: The cost for an agent to handle the paperwork and clear your shipment through customs.
- Prep Center Fees: Any costs for third-party services that label, bundle, or poly-bag your products to meet Amazon's strict requirements.
For instance, a product with a $5.00 factory cost can easily end up with a $7.50 landed cost once freight, duties, and prep are factored in. If you ignore that extra $2.50, your entire profitability model is built on flawed data.
Nail Down Amazon’s Complex Fee Structure
Once your inventory hits an Amazon warehouse, a whole new layer of fees emerges. Amazon's fee structure is complex, dynamic, and has a massive impact on your bottom line. You must account for it meticulously.
These are the primary fees to track for every sale:
Referral Fee: Amazon’s commission, typically 8-15% of your selling price. On a $30 item, a 15% fee instantly removes $4.50 from your top line.
FBA Fulfillment Fee: The charge to pick, pack, and ship your product. It’s based on size and weight, meaning smarter packaging directly lowers this cost.
Storage Fees: You're charged monthly for the space your inventory occupies. These fees skyrocket during Q4, making precise inventory planning essential. Long-term storage fees are punitive and can destroy the margins of slow-moving products.
Variable Closing Fees: These apply to media categories like books, DVDs, and video games.
Many sellers stop there, but that’s a mistake. You also have to consider smaller fees like return processing, inventory removal orders, and the new low-inventory-level fees. Ignoring these leads to a significant gap between your expected and actual P&L.
The line between a successful Amazon brand and a struggling one is often drawn by how well they master the fee structure. You don't have to love the fees, but you absolutely have to account for every last one.
Don't Forget Variable and Operational Costs
The final piece of the puzzle is allocating all other operational costs necessary to make a sale. These are the expenses most often missed in a per-unit calculation.
First, advertising. You must assign a portion of your PPC cost to every unit sold. The most effective method is to calculate your Total Advertising Cost of Sale (TACoS) for that product and apply it back to your sale price. We'll detail this critical calculation later.
Then, you have other product-specific operational costs:
- Packaging Materials: The cost of any custom boxes, mailers, or promotional inserts.
- Cost of Returns: You must factor in the cost of returned products. A simple method is to find your return rate (e.g., 4%) and multiply it by your landed cost. This creates an average "return cost" to add to every unit's expense sheet.
- Software & Subscriptions: A small, fractional amount for SKU-specific tools for inventory management, analytics, or repricing.
To get a complete view of your costs, I've put together a checklist that breaks down all the potential line items you should be tracking.
Comprehensive Cost Line Item Checklist
| Cost Category | Specific Line Item | Example Calculation/Note |
|---|---|---|
| Landed Costs | Manufacturing Cost | The per-unit price from your supplier. |
| Inbound Freight | (Total Freight Bill / Total Units Shipped) | |
| Duties, Tariffs & Import Taxes | Varies by HTS code and country of origin. | |
| Customs & Brokerage Fees | A flat or percentage-based fee for customs clearance. | |
| Prep Center Services | Cost per unit for labeling, bundling, or inspection. | |
| Amazon Fees | Referral Fee | Typically 8-15% of the total sale price. |
| FBA Fulfillment Fee | Based on your product's size tier and weight. | |
| Monthly Storage Fees | (Avg Daily Units x Volume per Unit x Monthly Rate) | |
| Other Amazon Fees | Include costs for returns, removals, and low-inventory fees. | |
| Marketing Costs | Advertising Cost Per Unit | (Total Ad Spend / Total Units Sold via Ads) |
| Promotions & Coupons | The dollar value of the discount applied per unit sold. | |
| Operational Costs | Outbound Packaging | Cost of boxes, mailers, inserts, etc., if not FBA. |
| Cost of Returns | (Return Rate % x Landed Cost per Unit) | |
| Allocated Software Costs | A small fraction of your monthly tool subscriptions. |
Using a detailed checklist like this prevents you from accidentally overlooking expenses that eat into your true profitability.
Beyond your COGS, identifying hidden costs and dynamic pricing strategies is where you'll find the real opportunities to improve your margins. This is where profit erosion happens without you even noticing.
Finally, while it’s more advanced, experienced sellers often allocate a portion of their fixed overhead (like salaries or office rent) to each unit. But for making quick, smart decisions on pricing and advertising, focusing on the variable costs to find your contribution margin is far more practical. Of course, before diving into advanced formulas, it's essential to have a solid understanding of how to calculate profit margins at a basic level.
By meticulously tracking every one of these line items, you'll build an honest, complete picture of your true cost per unit. That number—not the one on your supplier's invoice—is the only one you should be using to make every strategic decision for your brand.
The Essential Formulas for Amazon Profitability
Once you've nailed down all your costs, it's time to put those numbers to work. These formulas aren't just for your accountant; they are the daily tools for making intelligent decisions on pricing, advertising, and product lifecycle management.
We'll start with the basics and build up. First, Gross Profit, then the number that really matters for your ad strategy: Contribution Margin. Finally, we'll get the full story with Net Profit. I’ll walk you through each one with a realistic example so you can see how it all connects.

Gross Profit Per Unit: The Starting Point
Gross profit is the simplest calculation. It’s what you have left after paying for the product itself—your landed cost. Think of it as the first checkpoint. It's a useful number, but it's dangerously incomplete if you stop here.
The formula is as straightforward as it gets:
Gross Profit Per Unit = Sale Price – Landed Cost
Let's imagine you sell a high-quality yoga mat.
- Sale Price: $39.99
- Landed Cost: $11.50 (This bundles manufacturing, shipping, duties, etc.)
Plugging those in, you get:$39.99 (Sale Price) - $11.50 (Landed Cost) = $28.49 Gross Profit Per Unit
That $28.49 looks fantastic, but it ignores the significant chunk of expenses Amazon takes. It's a fine starting point, but a terrible place to make real business decisions.
Contribution Margin Per Unit: The Ad Manager's Bible
This is the metric that matters most. If you only track one number to guide your advertising, make it this one. Your Contribution Margin tells you exactly how much cash each sale contributes to covering your fixed business overhead after all per-sale costs are paid.
It builds on gross profit by subtracting every single cost that varies with a sale.
Contribution Margin Per Unit = Sale Price – All Variable Costs
Let's stick with our yoga mat example and add in those other costs:
- Sale Price: $39.99
- Landed Cost: $11.50
- Amazon Referral Fee (15%): $6.00
- FBA Fulfillment Fee: $5.50
- Advertising Cost Per Unit (10% TACoS): $4.00
- Return Cost (3% return rate x $11.50): $0.35
First, let's tally up the Total Variable Costs: $11.50 + $6.00 + $5.50 + $4.00 + $0.35 = $27.35
Now, we can find our Contribution Margin:$39.99 (Sale Price) - $27.35 (Total Variable Costs) = $12.64 Contribution Margin Per Unit
This $12.64 is your true, actionable profit per sale before paying for things like rent or salaries. This is the absolute maximum you can spend to acquire a customer for this product and break even on that specific transaction.
Your Contribution Margin is your strategic playground. It defines the absolute ceiling for your ad spend, reveals your true promotional flexibility, and empowers you to set intelligent campaign targets based on real margins, not revenue.
Net Profit Per Unit: The Complete Picture
Net Profit gives you the final, bottom-line number. It tells you what you actually bank from each sale after every single cost—variable and fixed—is accounted for. This is where you factor in business overhead.
Net Profit Per Unit = Contribution Margin Per Unit – Allocated Fixed Costs Per Unit
To figure this out, you need to spread your total monthly overhead across the number of units you expect to sell.
- Monthly Fixed Costs: $5,000 (salaries, software, insurance, etc.)
- Projected Monthly Sales: 1,000 units
- Allocated Fixed Cost Per Unit:
$5,000 / 1,000 = $5.00
Now, you just subtract that from your contribution margin:$12.64 (Contribution Margin) - $5.00 (Allocated Fixed Costs) = $7.64 Net Profit Per Unit
That $7.64 is what you're left with, clear and simple. While Contribution Margin is your go-to for daily ad management, Net Profit is what you use for long-term financial planning and judging the overall health of your business.
Breakeven ACOS and ROAS: Connecting Profit to Ad Performance
Here’s where the magic happens. Your contribution margin directly unlocks two of the most powerful metrics for any Amazon advertiser: Breakeven ACOS and Breakeven ROAS. They tell you exactly how high your ACOS can go or how low your ROAS can dip before a sale becomes unprofitable.
Breakeven ACOS = Contribution Margin (before ad costs) / Sale Price
For our yoga mat, the contribution margin before we subtracted the $4.00 ad spend was $12.64 + $4.00 = $16.64.
Let's run the numbers:$16.64 / $39.99 = 41.6% Breakeven ACOS
This means you can let your campaigns run all the way up to a 41.6% ACOS and you still won't lose money on the product itself. Any ACOS below that is generating profit.
You can also flip this to find your breakeven ROAS. If you want a deeper dive, check out our guide explaining how to calculate ROAS in more detail.
Breakeven ROAS = 1 / Breakeven ACOS
1 / 0.416 = 2.40 Breakeven ROAS
For every $1 you spend on ads, you need to generate at least $2.40 in sales just to break even. Having these guardrails turns PPC from a guessing game into a calculated strategy that protects your profit at all times.
Tying PPC Spend to Your Bottom Line
If you're only looking at your account-level Advertising Cost of Sale (ACOS) to see if a product is profitable, you're making a huge mistake. ACOS is a blended average that hides which products are actually making you money and which are draining your P&L. To get a real, actionable profit-per-unit number, you must allocate ad costs to individual sales.
This is where many sellers go wrong. They treat advertising like a general business expense—like rent or software—instead of what it is: a variable cost directly tied to generating a sale. This single oversight completely warps your unit economics. You might end up killing ad spend on a product that’s actually a growth engine, all because a vanity metric scared you.
Go Beyond ACOS: Blending Ad Spend with Organic Sales
The most accurate way to handle ad costs is by calculating your Total Advertising Cost of Sale (TACoS) for each product. ACOS only measures sales driven directly by ads. TACoS, on the other hand, measures your ad spend against all sales, both paid and organic. This gives you a much more realistic "PPC Cost Per Unit Sold."
Here's the formula:
TACoS = Total Ad Spend / Total Revenue (Ad Sales + Organic Sales)
This metric is a game-changer because it acknowledges the "halo effect" of PPC. Ads don't just create immediate sales; they boost visibility, improve organic ranking, and ultimately drive more organic sales down the road.
TACoS changes the question from "How much did I pay for that ad-driven sale?" to "How much am I investing in advertising to generate each total sale?" This is the exact mindset that separates stagnant brands from the ones that scale.
A Real-World Example: PPC as a Strategic Investment
Let's walk through a practical scenario. Imagine launching a new smart water bottle, getting aggressive with PPC to build early momentum.
- Sale Price: $50
- Contribution Margin (before ads): $20 per unit (a 40% margin)
- Monthly Ad Spend: $10,000
In month one, you sell 500 total units—250 from ads and 250 organically. Total revenue is $25,000.
Now, let's look at the metrics:
- ACOS: $10,000 Ad Spend / $12,500 Ad Revenue = 80%
- TACoS: $10,000 Ad Spend / $25,000 Total Revenue = 40%
An 80% ACOS looks terrifying. On its own, it screams that you're losing money. But the 40% TACoS tells the real story. Since your pre-ad contribution margin was also 40%, you're actually breaking even on every single unit sold. You aren't losing money; you're reinvesting your entire profit into acquiring market share and accelerating your organic rank.
Your PPC Cost Per Unit Sold is $20 ($10,000 Ad Spend / 500 Total Units). This temporarily wipes out your net profit, but in exchange, you've funded a launch that generated 250 organic sales and gave your Best Seller Rank (BSR) a massive boost.
Keep an Eye on the Bigger Picture
Your unit economics don't operate in a vacuum. Broader economic trends have a massive impact. For instance, post-pandemic research found that corporate profits contributed disproportionately to inflation, peaking at over 90% of price increases in some quarters between 2021 and 2022, a stark contrast to the historical average of around 11-12%. This shows that external market forces must be considered for a complete picture of profitability.
This is why a static, one-time calculation of profit is so dangerous. Fast forward to month three with your water bottle. Your organic rank is now solid. You might sell 1,000 total units while pulling back ad spend to just $5,000.
- Total Revenue: $50,000
- New TACoS: $5,000 / $50,000 = 10%
Suddenly, your PPC Cost Per Unit Sold has dropped to just $5.00 ($5,000 / 1,000 units). Your net profit per unit has shot up to $15.
That initial aggressive ad spend wasn't a loss. It was a strategic investment that unlocked a steady stream of highly profitable, long-term organic sales. That's the key: using PPC as a lever for sustainable growth, not just a faucet for quick revenue.
How to Actually Improve Your Profit Per Unit
Knowing your numbers is the starting point. Now comes the execution: making them better. Once you have a handle on your real profit per unit, you can start pulling specific levers to improve your margins. This isn't about vague advice; it's about making targeted changes that directly impact your bottom line.
The game plan is simple: systematically attack costs while strategically finding ways to increase revenue per sale. Small wins across a few areas can compound into a major boost in overall profitability.
Shrink Your Packaging, Grow Your Profit
This is one of the most overlooked—and most powerful—levers you can pull. Amazon’s FBA fees are based on strict size and weight tiers. A product that is a fraction of an inch too big can get bumped into the next, more expensive tier, costing you anywhere from an extra $0.50 to $1.50+ on every single sale.
Here’s a real-world performance example:
A client selling kitchen gadgets was paying more in FBA fees than projected. An audit revealed their box was just 0.8 inches over the "Small Standard" size limit. They worked with their supplier to design a slightly more compact box. The result? They dropped down an entire FBA size tier, saving $0.72 per unit. That one change added over $36,000 in pure profit to their bottom line that year.
Increase Order Value with Smart Bundles
Why sell one when you can sell two? Bundling is a fantastic way to increase your average order value (AOV). When you sell more in a single transaction, you spread your fixed costs—like FBA pick & pack fees and ad spend—across more revenue, instantly improving your unit economics.
Try these bundling strategies:
- Multi-Packs: Create listings for a single item, a 2-pack, and a 4-pack. Offer a small per-unit discount on the larger packs to make them a no-brainer for the customer.
- Accessory Bundles: Pair your main product with a high-margin add-on. For example, if you sell a coffee maker, bundle it with a set of reusable filters.
This approach doesn't just increase profit on the initial sale; it often leads to higher customer satisfaction and lifetime value.
Get Aggressive on Your Landed Costs
Your landed cost is never set in stone. You should be constantly looking for ways to chip away at your Cost of Goods Sold (COGS) through negotiation and smart supply chain management. Don't just accept the first quote you get from a supplier or freight forwarder.
A 5% reduction in your COGS can have a bigger impact on your net profit than a 5% increase in sales. Treat your supply chain like a profit center, not just a cost.
Make it a habit to review these costs at least twice a year:
- Supplier Negotiations: As your order volume grows, you gain leverage. Use it to ask for better pricing.
- Freight Shopping: Always get quotes from multiple freight forwarders. Rates change, and you want to be sure you aren't overpaying.
- Manufacturing Tweaks: Talk to your supplier. Sometimes a small change in materials or a more efficient production process can lower your costs without hurting quality.
This relentless focus on operational details is what separates good brands from great ones. Big corporations live and die by this stuff. For instance, in 2023, the average profit share for non-financial corporations in the EU was 41.3%, but that number varied wildly from country to country, largely due to different cost structures. You can read the full research about business profits in the EU to see how this plays out on a macro scale.
Your job is to make cost reduction a continuous, ongoing process. When you have precise profit-per-unit data, every decision—from packaging to pricing to PPC—becomes a calculated move toward building a more profitable business.
Common Questions About Unit Economics
Here are quick, no-nonsense answers to the questions I hear most often from e-commerce leaders about mastering their unit profitability.
How Often Should I Recalculate Profit Per Unit?
This is an ongoing health check, not a one-and-done calculation. Rerun the numbers anytime a significant cost changes.
As a rule, a full review every quarter is a smart operational cadence. This timing aligns with Amazon's FBA and storage fee adjustments and provides enough data to spot trends in ad performance. But you must immediately update your calculations if you:
- Renegotiate pricing with your supplier.
- See a significant swing in inbound shipping costs.
- Make a material change to your advertising budget or TACoS goals.
What’s the Difference Between Contribution Margin and Net Profit?
This is a crucial distinction for leaders. Contribution margin is what's left from a sale after subtracting all costs directly tied to that single sale—COGS, Amazon fees, and per-unit ad spend. It tells you how much cash each sale "contributes" toward paying your fixed, company-wide overhead like rent, software, and salaries.
Net profit per unit takes it a step further, subtracting a small, allocated piece of those fixed costs from each sale.
Our Recommendation: Use contribution margin for your day-to-day tactical decisions, like setting PPC bids and promotional discounts. Use net profit to judge the overall, long-term financial health of a product line and make strategic P&L decisions.
How Do I Account for Product Returns?
Returns can silently destroy your profits if you don't account for them properly. The most effective way is to calculate a "net revenue per unit" from the start.
First, determine the historical return rate for the product—let's say it's 5%. If you sell the item for $50, your real, effective revenue isn't $50. It's $47.50 ($50 x (1 - 0.05)).
But don't stop there. You must also subtract any non-recoverable costs from that return, like shipping, FBA return processing fees, or the product cost if it's damaged and cannot be resold. That's the only way to get a true picture.
Can I Use an Estimated PPC Cost Per Unit?
Yes, and you absolutely should. Trying to assign a specific ad click to a specific sale is a fool's errand. A smart, blended average is the most practical and accurate approach.
Here's how: Calculate your Total Advertising Cost of Sale (TACoS) for that product over a recent period, like the last 30 or 60 days. This is simply your total ad spend divided by your total revenue (from both ad-driven and organic sales).
Then, multiply your selling price by your TACoS percentage. That gives you a stable, blended advertising cost per unit. This method is far superior to using ACoS because it correctly captures the "halo effect"—how your ads lift organic sales and contribute to overall growth.
At Headline Marketing Agency, we translate complex unit economics into clear, actionable advertising strategies. We move beyond vanity metrics to build PPC and DSP campaigns that drive real, measurable profit for your brand—not just top-line revenue.
If you're ready to stop guessing and start scaling profitably, schedule a consultation with our Amazon advertising experts today.
Get Your Free Amazon PPC Audit
Discover untapped growth opportunities and see how our data-driven approach can improve your ROAS.
Get Free Audit →Wollen Sie Ihre Amazon PPC-Performance aufs nächste Level bringen?
Lassen Sie Ihre Amazon PPC-Kampagnen professionell analysieren und entdecken Sie neue Wachstumsmöglichkeiten.