How to Calculate TACoS: The Ultimate Metric for Amazon Growth
Obsessing over TACoS calculation alone costs brands real profit. Our framework considers the full profitability picture.
Calculating your Total Advertising Cost of Sale (TACoS) is simple: divide total ad spend by total sales revenue, then multiply by 100. But don't let the basic math fool you. For eCommerce leaders, this metric is the definitive measure of how advertising drives sustainable, profitable growth across your entire Amazon business—not just the sales you can directly attribute to a click.
Think of it as the ultimate health check for your Amazon flywheel, connecting PPC spend directly to organic velocity and long-term profitability.
Why TACoS Is Your True North Metric for Scale
It’s time to move beyond judging ad performance in a silo. While your Advertising Cost of Sale (ACoS) is a useful KPI for campaign-level efficiency, it only reveals a fraction of the story. ACoS measures how well your ads generate ad-attributed sales, but it completely ignores their impact on organic sales—the lifeblood of any scalable Amazon brand.
This is precisely why TACoS is your true north. It helps you answer the one question every brand leader on Amazon must ask: is my PPC spend building long-term brand equity and organic rank, or am I just renting customers in a never-ending cycle of paid acquisition?
By benchmarking your total ad spend against your total revenue, TACoS provides a holistic view of your advertising's true business impact.
Moving Beyond Campaign Efficiency
An obsessive focus on ACoS is a classic case of winning the battle but losing the war. You might hit your target ACoS on a specific campaign, but if your total revenue is flatlining, are you actually scaling? This is a common trap. Brands get stuck optimizing for short-term inputs instead of building a powerful growth engine where ads catalyze visibility, which in turn drives organic sales velocity.
Consider this: a top-performing Amazon brand we scaled in the competitive supplement space saw their ACoS hold steady at 22%, but their TACoS dropped from 18% to 9% over six months. Why? Because our aggressive PPC strategy doubled their organic sales ratio. The ads weren't just converting; they were building an organic moat.
The real power of TACoS lies in tracking the inverse correlation between ad spend and organic sales. A downward-trending TACoS is definitive proof that your PPC investment is creating a "halo effect," lifting your organic rank and systematically reducing your dependency on paid media.
Ultimately, TACoS connects every advertising dollar to your bottom line, validating a virtuous growth cycle. This is the flywheel top-tier brands leverage to build defensible market share:
- Strategic ad spend drives initial visibility and ad-attributed sales.
- Increased sales velocity signals to Amazon's A9 algorithm that your product is relevant, boosting its organic ranking.
- Improved organic rank generates a higher volume of "free" organic sales, allowing you to optimize ad spend for profitability.
This is the feedback loop that transforms ad spend from an expense into a strategic investment in profitable scale.
Putting Your TACoS Calculation into Practice
Let's move from theory to execution. Understanding the formula is one thing; knowing how to act on the result is where strategic leaders separate themselves. To demonstrate how TACoS guides performance-driven decisions, we'll walk through two scenarios every Amazon brand leader will recognize. This illustrates how TACoS should inform your ad strategy, whether you're in an aggressive launch phase or managing a mature product for profitability.
First, this breakdown visualizes the core components of the TACoS calculation—total revenue and ad spend.
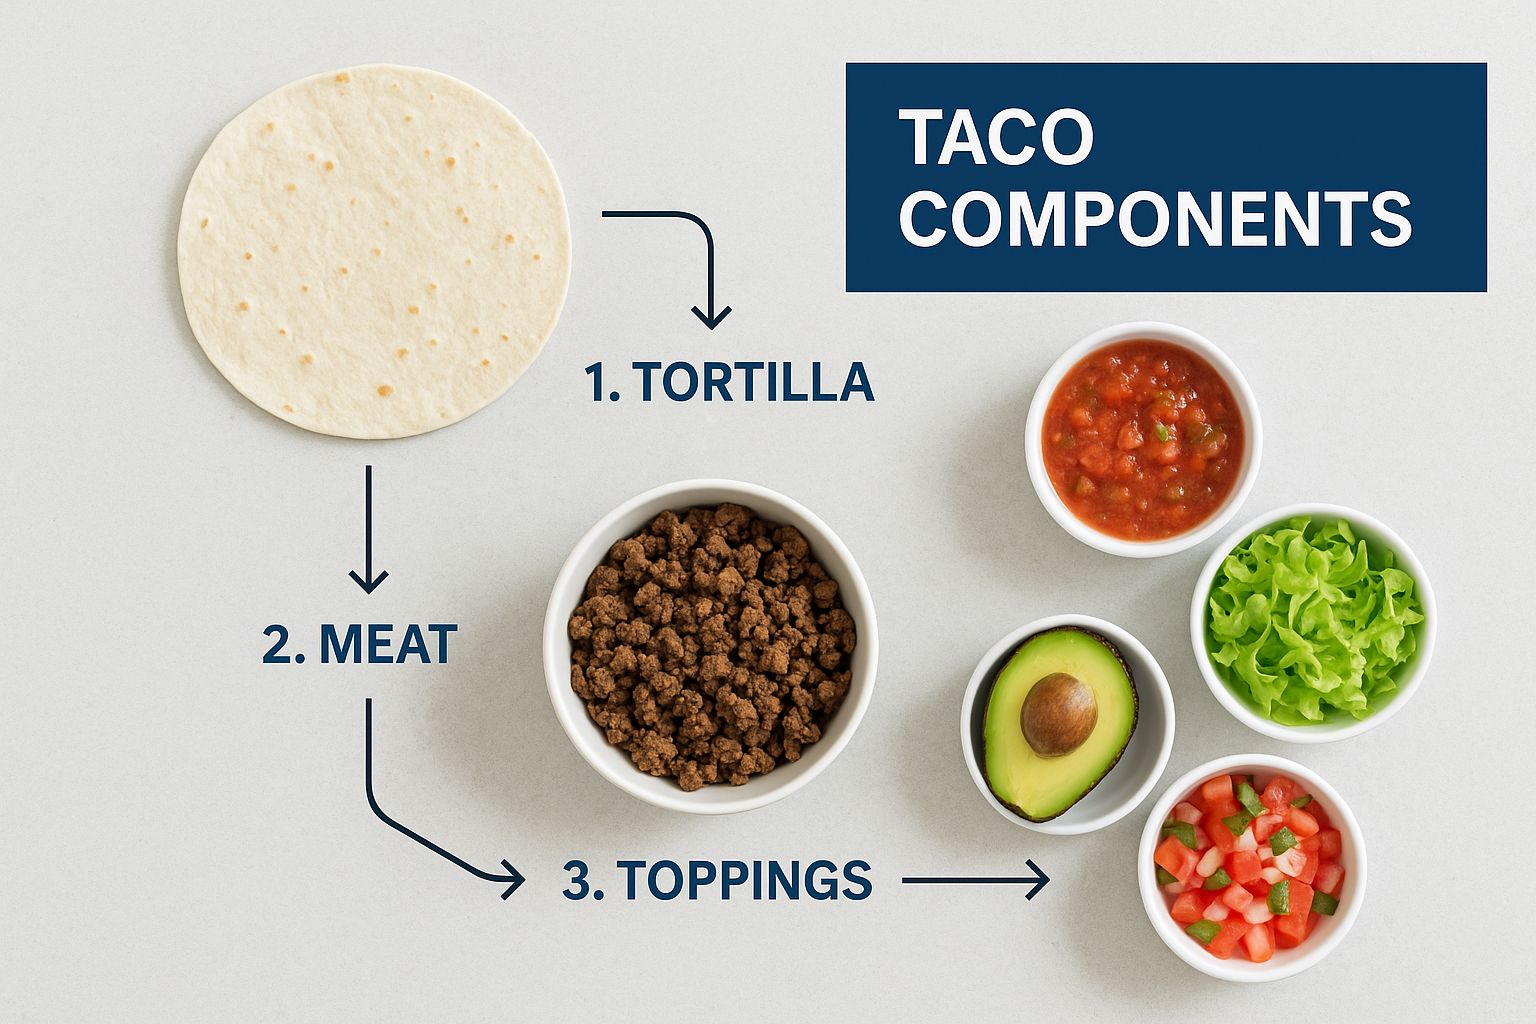
Seeing your revenue streams side-by-side drives home the core principle of TACoS: it measures the holistic relationship between your advertising investment and your overall business performance.
Scenario 1: The Product Launch
You're launching a new line of premium coffee grinders. Your primary objective is not immediate profitability. It's market penetration: generating sales velocity, securing early reviews, and aggressively climbing Amazon's organic search rankings.
In this launch phase, a high TACoS is not only expected—it's a strategic necessity. You are investing in data, sales history, and visibility. Strong initial keyword targeting is critical for momentum. If you need a refresher, our guide on Amazon PPC keyword research provides an actionable framework.
Here’s what the initial performance data might look like:
- Total Ad Spend: $10,000
- Ad Sales: $15,000
- Organic Sales: $5,000
- Total Revenue: $20,000
Running the calculation gives us: ($10,000 Ad Spend ÷ $20,000 Total Revenue) x 100 = 50% TACoS
A 50% TACoS looks alarming in isolation, but it's intentional. You are effectively buying market share and training the algorithm. The primary KPI is not the TACoS itself, but its trend over the next 3-6 months. The goal is to see this number decline as organic sales gain traction.
Scenario 2: The Mature Product
Fast-forward six months. The coffee grinder is now an established player. It has a strong review count, consistent sales history, and a solid organic rank for high-value keywords. The strategic focus has pivoted from pure growth to sustained profitability.
At this stage, advertising should support and defend your market position, not be the sole driver of sales.
Let’s review the Month 6 data:
- Total Ad Spend: $4,000
- Ad Sales: $8,000
- Organic Sales: $32,000
- Total Revenue: $40,000
Now, let's recalculate TACoS: ($4,000 Ad Spend ÷ $40,000 Total Revenue) x 100 = 10% TACoS
The drop from 50% to 10% is a clear indicator of success. It's hard data proving that the initial PPC investment successfully built a powerful organic foundation. Your brand is now more sustainable, more profitable, and a perfect example of the Amazon flywheel effect in action.
Using TACoS to Make Smarter Growth Decisions
Calculating your TACoS is the easy part. The real value comes from interpreting the trend over time to make strategic, performance-driven decisions. This is how you transition from merely managing ad spend to orchestrating brand growth.
A falling TACoS is the ultimate proof that your advertising is creating a virtuous cycle. It shows your ad spend is not just buying immediate sales but is actively building your organic presence. Essentially, your ads are generating sufficient visibility and sales velocity to trigger Amazon’s algorithm, which rewards you with higher organic rankings. More customers find you without a paid click. That is the hallmark of a healthy, scalable brand.
Conversely, a rising or stagnant TACoS is a critical red flag. It suggests your growth engine is stalling. This could be due to several factors: ad campaign inefficiency, market saturation, or new competitors driving up auction prices. Allowing this trend to persist is a direct threat to your profitability.
Interpreting Your TACoS Trend
Your TACoS trend is a strategic compass, telling you whether to double down on your current strategy or to diagnose a problem.
When Your TACoS is Decreasing: This is your green light for aggressive action. Your advertising is effectively fueling organic growth. We often advise clients in this position to reinvest a portion of their profits into their best-performing campaigns to accelerate market share capture and solidify top organic positions.
When Your TACoS is Increasing: Time to perform a root cause analysis. A knee-jerk budget cut is the wrong move. First, examine your ACoS. If ACoS is also climbing, your campaigns likely need optimization. But if ACoS is stable while TACoS is rising? That points to an erosion of organic sales. Dig deeper into your organic keyword rankings, competitor activity, and conversion rates on your product detail page.
Key Takeaway: A rising TACoS is a symptom, not the disease. Before taking action, you must diagnose the root cause. It could be an advertising issue, an organic ranking problem, or a conversion flaw on your product listing.
This diagnostic approach mirrors how sophisticated brands analyze their overall marketing efficiency ratio to gauge the holistic impact of their marketing budget. By analyzing your TACoS trend, you transform a simple metric into a powerful tool for scaling your Amazon business profitably.
Common Mistakes When Analyzing TACoS
Integrating TACoS is a significant step, but misinterpreting the data can lead to flawed strategic decisions. To keep your analysis sharp and actionable, avoid these common pitfalls that can derail your growth strategy.
Looking at Too Short a Timeframe
The single biggest blunder is making decisions based on a short-term TACoS, such as a 7-day lookback window. A weekly TACoS is highly susceptible to noise. A one-off lightning deal, a new campaign launch, or a weekend sales anomaly can dramatically skew your numbers, providing a distorted view of your advertising's true performance.
For a reliable read on advertising's business impact, you need a longer timeframe—at least 30 days is the standard. This smooths out daily volatility and reveals the underlying strategic trend.
Forgetting the "Why" Behind the Numbers
The second critical error is analyzing TACoS in a vacuum. The number itself doesn't provide the narrative. A sudden spike might not signal ad failure; it could be a new, aggressive competitor entering the market and driving up CPCs across the board.
To get the full story, you must layer in business context. Always ask why the number changed.
- What is the seasonality? A rising TACoS in Q4 might be a planned investment for a toy brand but a major red flag for a swimwear company.
- What is your inventory position? A stockout on your hero SKU will decimate organic sales and cause your TACoS to skyrocket, even with unchanged ad spend.
- Where is the product in its lifecycle? A 50% launch TACoS is incomparable to the steady 10% TACoS of a mature cash cow. They serve entirely different strategic purposes.
The most dangerous mistake is treating TACoS as a simple pass/fail grade. It’s not. It’s a diagnostic tool. A high TACoS can be a smart, strategic investment, while a low TACoS might indicate you're being too conservative and ceding market share to competitors.
Avoiding these traps is what separates tactical managers from strategic leaders. It ensures your TACoS analysis provides a true signal of your advertising’s health and its real impact on your bottom line.
Balancing TACoS and Profitability
Your TACoS doesn't exist in a vacuum; it is inextricably linked to your brand’s P&L. The art of scaling on Amazon lies in finding the strategic balance between investing in aggressive growth—which may temporarily elevate your TACoS—and protecting profit margins to ensure sustainable cash flow.
Too many leaders view TACoS as a pure cost metric. This is a mistake. It’s a strategic lever. A high TACoS is not inherently negative if it’s part of a deliberate growth plan, just as a low TACoS is not inherently positive if it signals stagnation.
Setting Your Target TACoS
So, what is a good target TACoS? The answer depends entirely on your product's lifecycle stage and your current business objectives. There is no universal benchmark.
Keep in mind that for many private label sellers on Amazon, a healthy net profit margin hovers between 15% and 25%. Your TACoS strategy must operate within this financial reality.
Here are a few common strategic scenarios:
Aggressive Market Capture: During a product launch, your primary goal is gaining traction. In this phase, a TACoS that meets or even temporarily exceeds your profit margin is the cost of entry. You are buying market share and data.
Sustained Growth: For an established product, your TACoS should be comfortably below your profit margin. This indicates that your ad spend is efficiently supplementing a strong organic sales baseline.
Profit Maximization: For a mature, category-leading product, the objective shifts to defending your position with maximum efficiency. A very low TACoS here demonstrates that the brand has achieved significant organic momentum.
A TACoS that remains high indefinitely without a corresponding lift in organic sales is a direct threat to your profitability. However, a rock-bottom TACoS may indicate you are underinvesting, allowing aggressive competitors to erode your market share.
This performance-first mindset is crucial. Your ad strategy must support your financial goals, not compromise them. By regularly analyzing TACoS trends against your profitability targets, you ensure every ad dollar is a smart investment in sustainable scale.
For a deeper dive into aligning ad spend with financial goals, this guide on Amazon advertising optimization provides excellent frameworks.
How to Find Your Breakeven Point (And Why It Matters for TACoS)
Knowing your TACoS is one thing; connecting it to your actual profitability is another. This is where your breakeven point becomes an essential financial guardrail. It's the line in the sand your advertising cannot cross without actively losing money.
Frankly, operating without knowing this number is like flying blind—you can’t scale a brand by lighting cash on fire.
To find it, you must first calculate your breakeven ACoS. This is simply your product's profit margin before ad spend. Once you know this, you know the absolute maximum ACoS you can sustain before a sale becomes unprofitable.
Calculating Your Breakeven ACoS
Let's walk through a no-nonsense example.
First, determine your pre-ad-spend profit per unit. This requires subtracting all non-advertising costs from your sale price. Be meticulous: include your cost of goods, all Amazon fees, shipping, and any other overhead.
Assume you sell a product for $50. After a full accounting, your total costs (excluding ads) are $30.
- Your pre-ad profit is $20 per unit.
Now, calculate your profit margin by dividing that profit by the sale price.
- ($20 Profit ÷ $50 Price) = 40%
This is your breakeven ACoS: 40%. If a campaign's ACoS rises above this threshold, you are losing money on every ad-driven sale. Stay below it, and you're profitable.
The strategic insight comes from comparing your TACoS to this breakeven point. If your TACoS is well below your breakeven ACoS, your total advertising investment is healthy and your organic sales are providing a strong profitability buffer. However, if your TACoS begins approaching—or worse, exceeding—that breakeven point, your alarm bells must sound. It’s a clear signal that your overall growth strategy is becoming financially unsustainable.
This simple comparison provides the confidence to set intelligent budgets and make aggressive bids when strategically sound. It shifts the internal conversation from a generic "How much should we spend?" to a data-driven "How much can we profitably invest to accelerate growth?" This is how you ensure every dollar spent on ads contributes to building a scalable, long-term business on Amazon.
Common Questions About TACoS (And Our Answers)
Even after mastering the formula, practical questions inevitably arise. Understanding TACoS in theory is different from leveraging it in day-to-day operations. Here are the most frequent questions we field from eCommerce leaders integrating TACoS into their Amazon strategy.
What’s a “Good” TACoS for an Amazon Brand?
There is no universal "good" number. The right TACoS is entirely contextual, determined by your product's lifecycle, category competitiveness, and current strategic objectives.
- For a new product launch: A TACoS of 25% or higher can be a smart, necessary investment to build sales velocity and penetrate the market.
- For a mature, established product: The goal should be a much lower, stable TACoS, often in the 5-10% range. This signifies a healthy organic sales foundation.
The most important metric is not a static number, but the trend line. A consistently decreasing TACoS over time is the ultimate indicator of a winning strategy. It provides definitive proof that your advertising is building a more powerful organic footprint for your brand.
How Often Should I Be Calculating TACoS?
For most brands, a monthly analysis of TACoS provides the ideal balance of strategic insight and responsiveness.
Weekly checks often lead to reactive, data-whiplash decisions. A short-term sales spike or a new campaign launch can create statistical noise. A monthly view smooths these anomalies, revealing the true underlying impact of your advertising. It's frequent enough to enable course correction without overreacting to meaningless fluctuations.
What’s the Real Difference Between ACoS and TACoS?
This is a critical distinction that many brands get wrong. Think of it this way:
ACoS (Advertising Cost of Sale) measures campaign efficiency. It isolates ad spend against sales generated directly from those ads. It answers the question: "Are my ads efficient at converting clicks to sales?"
TACoS (Total Advertising Cost of Sale) measures overall business impact. It compares the same ad spend against your total revenue, including organic sales. It answers the bigger, more important question: "Is my advertising investment effectively and profitably growing my entire business on Amazon?"
ACoS tells you if your ads are efficient. TACoS tells you if your advertising strategy is effective.
At Headline, we look beyond surface-level metrics. Our mission is to build advertising strategies that don't just deliver a low ACoS today, but drive profitable, long-term brand growth. We leverage TACoS to ensure every dollar you invest is a down payment on a more dominant, defensible, and sustainable business on Amazon.
Discover how our data-driven approach can scale your business at headlinema.com
Get Your Free Amazon PPC Audit
Discover untapped growth opportunities and see how our data-driven approach can improve your ROAS.
Get Free Audit →Ready to Transform Your Amazon PPC Performance?
Get a comprehensive audit of your Amazon PPC campaigns and discover untapped growth opportunities.