How to Calculate Return on Ad Spend for Profitability & Scale
Learn how to calculate return on ad spend effectively. Discover key strategies to maximize your ad ROI and drive business growth today.

On the surface, calculating Return on Ad Spend (ROAS) is simple division: Revenue from Ads ÷ Cost of Ads. But for growth-focused leaders, that formula isn't the end—it's the beginning. The real value of ROAS lies in using it as a diagnostic tool to understand what’s driving profitable growth and where your budget is being wasted.
It’s how you move from simply spending money on ads to strategically investing in sustainable market share.
Why ROAS Is a C-Suite Metric, Not Just a Marketing KPI
Too many leaders relegate ROAS to the marketing department—a line item on a report to be checked off. This is a critical mistake. When understood correctly, ROAS becomes a powerful lever for strategic decision-making, influencing everything from inventory forecasting to cash flow management.
Viewing ad spend as a mere short-term cost is an outdated model. The forward-thinking approach is to treat it as an investment that fuels a virtuous cycle of growth. A high-performing ad campaign doesn't just generate immediate sales; it propels your products up the organic rankings on platforms like Amazon, builds brand equity, and systematically captures market share from competitors.
Turning a Simple Ratio Into a Strategic Advantage
Knowing how to calculate return on ad spend is table stakes. The real skill is translating that number into a strategic directive.
Consider a real-world Amazon scenario: A Sponsored Brands campaign is delivering a strong ROAS. This isn't just a marketing win. It's a clear signal of strong brand resonance, which directly impacts organic performance. For one of our clients in the competitive CPG space, we observed that a 15% lift in ad-driven traffic from a targeted campaign resulted in a sustained 8% increase in their organic search ranking for primary keywords within six weeks. This is the flywheel effect in action: paid advertising directly strengthens your organic foundation.
This strategic linkage is non-negotiable in a market where global advertising spend has surpassed $1.08 trillion. You can't afford to guess. In a saturated digital landscape, knowing your precise return is fundamental to survival and scale.
ROAS cuts through the noise. It forces a performance-first mindset and answers the one question every business leader must ask: "Is this investment driving profitable growth for the business?"
Of course, ROAS doesn't exist in a vacuum. For a holistic view of marketing's impact on total revenue, the Marketing Efficiency Ratio is essential. But for sharp, tactical decisions at the campaign level, ROAS remains the gold standard for ensuring your ad budget works as hard as you do.
Gathering Your Ad Data The Right Way

The ROAS formula is useless if you're feeding it flawed data. Your calculation is only as reliable as its inputs: total ad-attributed revenue and total ad spend. The most common pitfall for brands is using incomplete or inaccurate numbers, which guarantees a flawed strategy.
It's the classic "garbage in, garbage out" problem. Let's ensure you're pulling the right data from the right places.
For Amazon sellers, your data lives in Seller Central and the Amazon Advertising console. These dashboards are data-rich, but they can be a minefield of vanity metrics if you don’t know what truly matters for profitability.
Beyond The Platform's "Spend" and "Sales" Metrics
Simply pulling the top-line "Spend" and "Sales" figures from your campaign manager is insufficient for a true profitability analysis. To get an accurate picture, you must dig deeper. Many sellers neglect to account for the "hidden" costs that silently erode real returns.
These often-overlooked expenses can significantly inflate your ROAS, making a campaign appear far more successful than it is. To calculate ROAS accurately, you must track all associated advertising costs.
Here’s what is frequently missed:
- Agency or Management Fees: If you partner with a PPC agency or use sophisticated management software, those fees are a direct part of your total ad spend.
- Creative Production Costs: The budget for video assets, your Brand Store design, or the A+ Content that supports your campaigns—it all counts toward the investment.
- Third-Party Tool Subscriptions: Are you paying for specialized analytics platforms, keyword research tools, or automation software? These are advertising costs.
The objective is to move beyond the surface-level metrics served up by ad platforms. To truly understand performance, you must account for every dollar invested in your advertising ecosystem—not just the cost of the clicks.
When you rigorously track these figures, you build a data foundation you can trust. This empowers you to make confident, data-backed decisions and hold your teams or agency partners accountable for true profitability.
Putting the ROAS Formula to Work
With clean data in hand, it's time for the straightforward part: applying the ROAS formula.
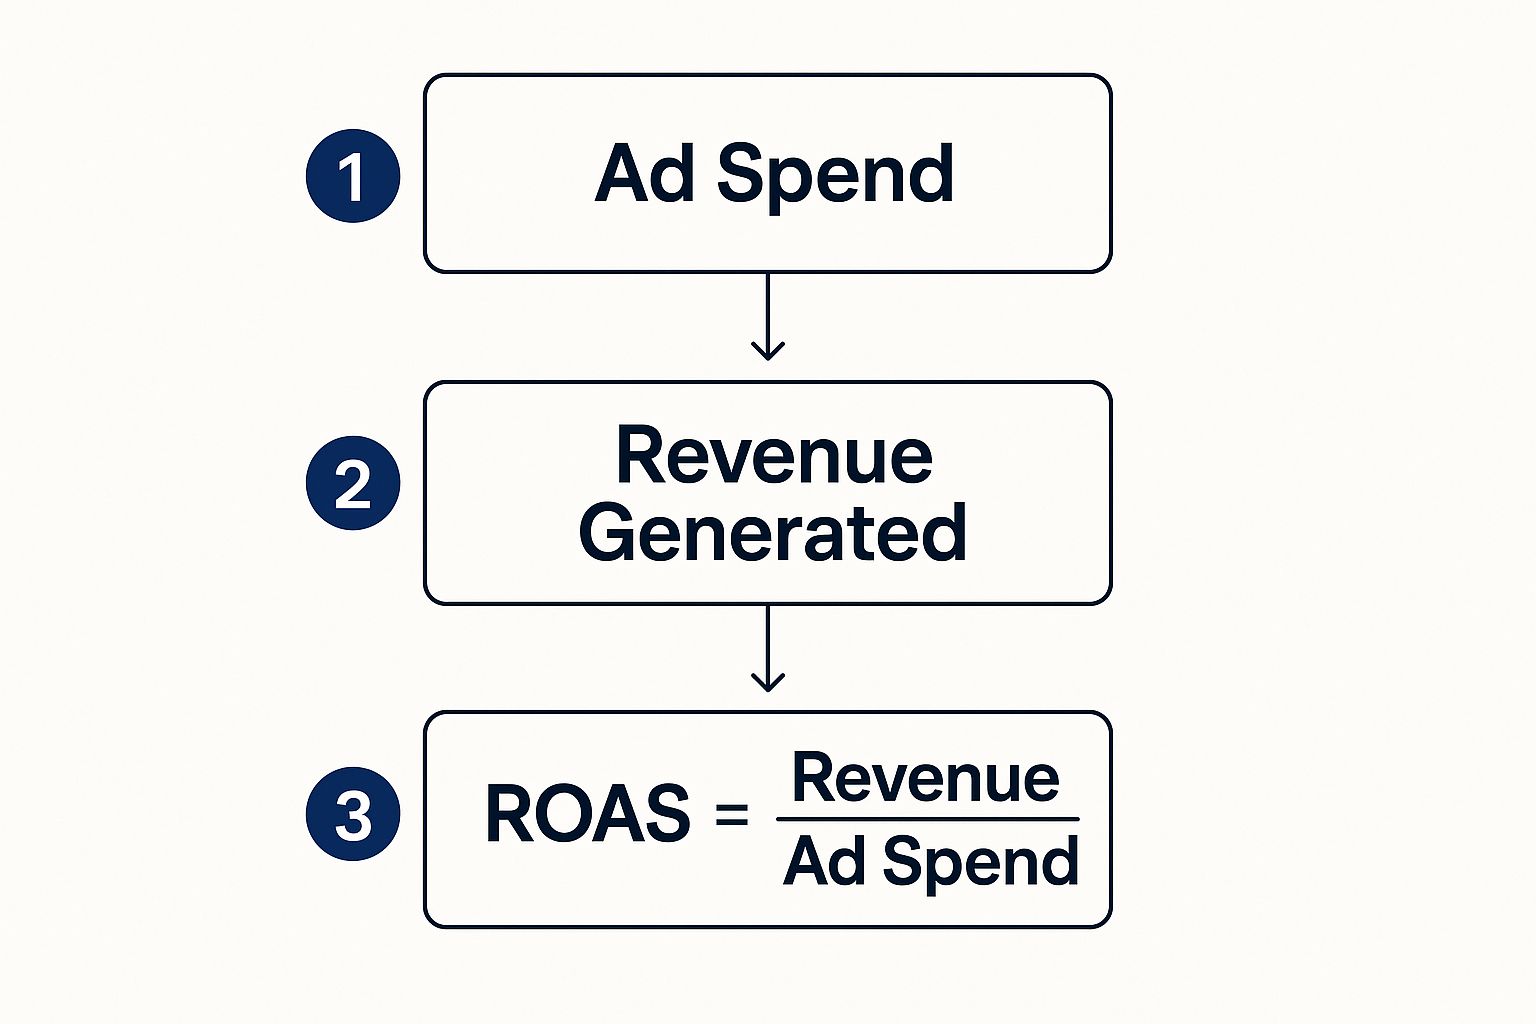
It’s a simple calculation: Total Ad Revenue / Total Ad Spend = ROAS.
This is the point where raw data begins to tell a story about campaign efficiency, profitability, and opportunity.
This visual breaks down the direct path from your ad spend to your return.

The elegance of ROAS is its simplicity. Ad spend is the investment, revenue is the gross return, and the ratio is your core efficiency metric. But remember, a "good" ROAS is entirely contextual, defined by your profit margins, business objectives, and competitive landscape.
What's a Realistic Target ROAS?
A higher ROAS is not axiomatically better. Let's analyze two common Amazon scenarios.
- Scenario A (High ROAS, Low Margin): You run a campaign for a popular, low-cost kitchen gadget. You spend $500, generating $2,500 in sales. That's a 5:1 ROAS.
- Scenario B (Lower ROAS, High Margin): You sell a premium coffee machine. The campaign costs $1,000 and generates $3,000 in sales. The ROAS is 3:1.
At first glance, Scenario A seems superior. But profitability is the ultimate arbiter. If the coffee machine has a 50% profit margin and the kitchen gadget only has a 15% margin, the profit from each scenario is starkly different. Scenario B is significantly more profitable.
This is why your first step must always be to calculate your break-even ROAS. The formula is 1 / Profit Margin. For the coffee machine, the break-even point is 1 / 0.50 = 2:1. Any ROAS above 2:1 on that product is generating profit.
A "good" ROAS is one that clears your break-even threshold and propels you toward your strategic goal—be it maximizing profit, aggressively capturing market share, or accelerating long-term organic rank.
Mastering these details separates competent campaign management from strategic, growth-oriented leadership. For those looking to go deeper on execution, our guide to Amazon advertising optimization is a valuable next step.
Making Sense of Your ROAS for Smarter Decisions

You've calculated your ROAS. That’s step one. The real value creation begins now. The number itself is just data; its interpretation is what drives business growth.
I'm constantly asked, "What is a good ROAS?" The only correct answer is: it depends. It’s a function of your profit margins, strategic objectives, and market dynamics. A fantastic ROAS for one brand could be a failure for another.
While benchmarks suggest e-commerce brands often target a 4:1 to 10:1 ROAS, these are generic guides. Industry averages are notoriously unreliable, skewed by platform, market maturity, and business model. For a broader look, you can find insights about ROAS statistics and benchmarks, but your own data is what matters.
Look Beyond the Simple Ratio
I’ve seen countless brands fall into the "high ROAS trap." An obsession with maximizing the ratio can lead to timid, risk-averse strategies—running tiny campaigns with minimal spend that fail to acquire new customers or expand market presence. A high ROAS on low volume is not a strategic win.
To develop a true understanding of performance, analyze ROAS alongside other critical business metrics.
Profit Margin: This is non-negotiable. A 3:1 ROAS on a product with a 50% margin is vastly superior to a 5:1 ROAS on a product with a 15% margin. Know your break-even point for every product category.
Customer Lifetime Value (LTV): Is your ad acquiring a one-time buyer or a loyal customer? A lower ROAS on the initial purchase can be a brilliant investment if it acquires a high-LTV customer who makes repeat purchases.
The Organic Rank "Halo Effect": On a marketplace like Amazon, aggressive advertising directly boosts organic search rank. This lasting visibility is a valuable asset that a simple ROAS calculation completely ignores.
A strategic leader knows when to optimize for profit and when to accept a lower ROAS to fuel broader business goals. During a new product launch or a campaign to unseat a competitor, you might deliberately operate near your break-even ROAS. The objective isn't immediate profit; it's market penetration and momentum.
This is the critical mindset shift: you stop managing ad campaigns and start directing the business. Ad spend becomes a powerful lever to influence not just direct revenue, but your entire market position. It's about deciding whether you're playing for today's profit or tomorrow's dominance.
ROAS is a critical starting point, but if you're serious about understanding the total impact of your advertising, you must adopt Total Advertising Cost of Sale (TACoS).
This metric connects your ad investment to your overall business health. The formula is simple: Total Ad Spend / Total Revenue.
What makes TACoS so powerful? Unlike ROAS, which is limited to ad-attributed sales, TACoS measures your ad spend against all sales, including organic. This is crucial on platforms like Amazon, where effective advertising drives a powerful halo effect, boosting organic rank and brand recall that fuel sales long after the initial click.
Seeing The Bigger Picture with TACoS
Let’s walk through a real-world scenario. You increase ad spend to support a new product launch. Your ROAS will likely dip initially, which might seem alarming.
However, if your TACoS is stable or decreasing during this period, it's a massive win. It’s a clear data point proving that your advertising investment is successfully fueling organic growth. For example, a client in the home goods category saw their TACoS decrease from 12% to 9% over a quarter, even as they doubled their ad spend. This demonstrated that for every new ad-driven sale, they were generating more than one additional organic sale—a sign of a brand reaching a tipping point.
This insight is vital. With ad spend in North America reaching $348 billion and Asia-Pacific hitting $272 billion, the pressure to prove business impact is immense. You can explore more on these global advertising patterns and their implications.
TACoS elevates the conversation from short-term campaign efficiency to long-term, sustainable growth. It proves your ad spend isn't just an expense—it's an investment in your brand's total market share and profitability.
Of course, this strategy requires disciplined budget management. Eliminating wasted ad spend is paramount. A rigorous negative keyword strategy is one of the most effective tools for this. To tighten your budget, explore our guide to mastering Amazon Ads negative keywords and ensure every dollar is driving forward momentum.
Getting to Grips with Your ROAS
Knowing the formula is one thing; applying it effectively in the real world brings up practical questions. Here are the most common queries I hear from brand leaders, answered with a no-nonsense, performance-first focus.
What Is a Good ROAS for an Amazon Business?
This is the million-dollar question, and the only honest answer is: it depends entirely on your unit economics and strategic goals. A 4:1 ROAS might be excellent for a high-margin supplement brand, while a 2:1 could be a strategic victory for a new CPG brand aggressively acquiring market share.
Your first action must be to calculate your break-even ROAS. The formula is 1 ÷ Profit Margin.
If your profit margin is 25% (0.25), your break-even ROAS is 1 ÷ 0.25 = 4:1. You must generate $4 in revenue for every $1 in ad spend just to cover the cost of goods and ad spend for that sale.
A "good" ROAS is any figure above your break-even point that aligns with your current strategic objective—be it maximizing profit, accelerating growth, or liquidating inventory.
How Often Should I Calculate My ROAS?
Adopt a two-speed approach. For tactical campaign management, you should be monitoring ROAS weekly. This allows for agile adjustments—shifting budget from underperforming campaigns to winners and optimizing bids.
However, do not make major strategic decisions based on short-term fluctuations. For a true strategic assessment, analyze performance on a monthly or quarterly basis. This methodology smooths out daily volatility and provides a clearer picture of how advertising is impacting total business health, including the crucial lift in organic sales.
A low ROAS isn't just an advertising problem; it's a business diagnostic. It signals a need to investigate the entire funnel—from ad creative and targeting to your product detail page, pricing strategy, and even inventory levels.
My ROAS Is Low. What Should I Check First?
It's tempting to blame the ads. But a low ROAS is often a symptom of a problem further down the customer journey. Before slashing budgets, conduct a swift, systematic audit.
Here is my go-to diagnostic checklist:
- Validate Your Data: Are your inputs correct? Confirm you're using fully-loaded ad costs and accurate revenue attribution. Garbage in, garbage out.
- Review Your Targeting: Are your ads reaching high-intent buyers? A mismatch between your audience targeting and your product's value proposition is a primary cause of wasted spend.
- Audit the Conversion Path: What happens post-click? A low ROAS is a classic indicator of conversion rate issues. Investigate your product detail page. Are your price point, imagery, copy, and customer reviews competitive? A recent influx of negative reviews can torpedo an otherwise solid campaign.
At Headline Marketing Agency, we move beyond simple ROAS calculations. We build comprehensive advertising strategies architected for profitability and sustained organic growth. If you’re ready to transform your Amazon ad spend from an expense into a strategic growth driver, let's connect.
Ready to Transform Your Amazon PPC Performance?
Get a comprehensive audit of your Amazon PPC campaigns and discover untapped growth opportunities.