Master Your Amazon Advertising Reporting
Most sellers track the wrong Amazon ad reporting. Our approach focuses on the numbers that actually drive profit and growth.

Amazon advertising reports are the key to understanding how your campaigns are really doing. They provide the hard data you need to track performance, spend your ad budget wisely, and ultimately, grow your profits. Think of these reports as your roadmap—they show you what’s working, what isn't, and how to turn raw numbers into a winning strategy.
Why Your Amazon Reporting Matters

Trying to run Amazon ads without checking your reports is like driving blindfolded. You might get somewhere, but it's probably not where you want to go. In a marketplace this competitive, where ad costs are always on the rise, data isn't just a nice-to-have; it's everything. Learning to read and act on these reports is what separates the stalled accounts from the ones that scale successfully.
It's easy to get fixated on surface-level numbers like impressions and clicks, but real success on Amazon is measured in profit and strategic growth. Your reports are what get you there.
Beyond Basic Campaign Tweaks
The most successful sellers I've worked with use their advertising data for far more than just minor bid adjustments. They let the data guide their entire business strategy.
Here’s how they do it:
- Smarter Inventory Planning: When you see which products are flying off the shelves thanks to your ads, you can predict your inventory needs much more accurately. This helps you avoid devastating stockouts on your winners and stop wasting capital on slow-movers.
- Finding New Product Ideas: The Search Term Report is an absolute goldmine. It shows you exactly what shoppers are looking for. If you keep seeing searches for a product you don't carry, you may have just discovered a gap in the market waiting to be filled.
- Gauging True Profitability: ACoS (Advertising Cost of Sale) only tells part of the story. You need to look at TACoS (Total Advertising Cost of Sale), which compares your ad spend to your total revenue. This gives you a much clearer picture of how your ads are lifting your organic sales and contributing to the overall health of your business.
Getting your ads in the right spot is non-negotiable. It’s a well-known fact that 75% of Amazon shoppers never even look at the second page of search results, which makes grabbing those top ad placements incredibly important. And the fight for those spots is only getting tougher, with Amazon's global ad revenue expected to skyrocket from $37.7 billion in 2022 to $94 billion by 2026. You can find more details on how Amazon ad placements affect performance at Algofy.
A classic rookie mistake is chasing a low ACoS at all costs. I've seen sellers pause a high-ACoS keyword, only to watch their organic rank and total sales plummet. Sometimes, you have to accept a higher ACoS on a crucial keyword because it's driving the flywheel effect. Your reports give you the context to make those smart, strategic calls.
At the end of the day, mastering your Amazon advertising reports is about taking control. It’s about moving from guesswork to informed decisions that directly boost your bottom line. Every report you download is a chance to sharpen your strategy, eliminate wasted ad spend, and find new ways to grow your brand on the world's biggest eCommerce stage.
Finding The Reports You Actually Need
The Amazon Advertising console can feel like a maze. With all its menus and report options, it’s easy to get overwhelmed. But here’s the secret: you don't need to look at every single one.
In my experience, focusing on just a few key reports gives you 80% of the data you need to make smart, profitable decisions. The first step is simply knowing where to click.
You'll spend most of your time in the Campaign Manager. From there, look for a tab called "Measurement & Reporting." That's your home base for pulling all the performance data for your Sponsored Products, Sponsored Brands, and Sponsored Display campaigns. It’s a lot simpler than it looks.
This is the basic path to get to your data:
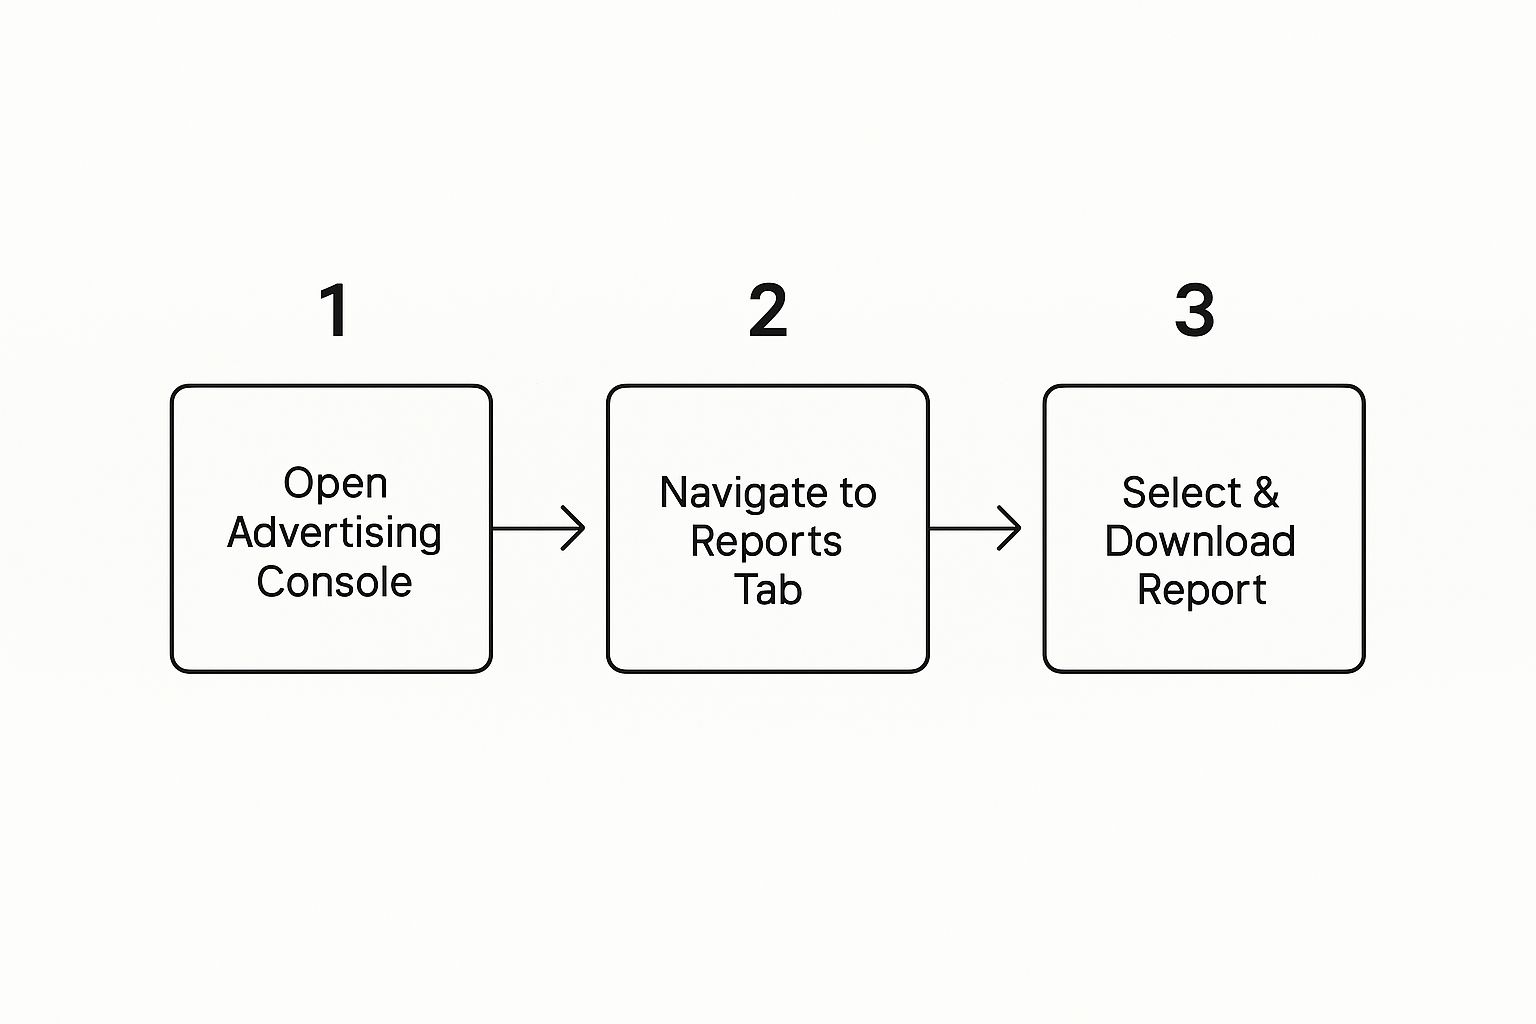
As you can see, it's a straightforward, three-step action. Don't let the interface intimidate you.
The Core Reports To Prioritize
Once you’re in the reporting section, hit the "Create report" button. This is where the magic happens. While you'll see a long list of options, I find myself coming back to the same handful of reports again and again. Why? Because they deliver the most actionable insights.
These are the reports I pull for virtually every account I manage:
- Search Term Report: This is your gold mine. It shows you the exact search queries customers typed before clicking your ad. You’ll see which terms are making you money and which are just burning through your budget.
- Targeting Report: This one dives into the performance of your keywords and product targets (ASINs). It’s what I use to fine-tune bids and double down on what’s working.
- Purchased Product Report: If you sell more than one product, you need this report. It reveals which of your ASINs were bought after a shopper clicked an ad for a different product. It’s fantastic for spotting unexpected cross-selling opportunities.
- Placement Report: This report shows you where your ads appeared—like "top of search" versus deep on a "product page." This data is crucial for adjusting your bids to be more aggressive where it really matters.
I once had a client whose ACoS was mysteriously climbing. We pulled the Placement Report and found a glaring issue: over 70% of their ad spend was going to "rest of search" placements that had a terrible conversion rate. We made a quick bid adjustment to focus on "top of search," and their ACoS dropped by 15 points in just two weeks.
Generating Your First Report
Let’s quickly walk through creating a report. After you click "Create report," you'll see a screen where you can customize what data you want to pull.
It's a simple form where you'll define three main things:
- Campaign Type: Are you looking at Sponsored Products, Brands, or Display?
- Report Type: This is where you pick from the list we just discussed, like the "Search term" report.
- Time Period: For big-picture strategy, I almost always use a 30-day lookback. If I'm just doing a quick check-in on a new campaign, a 7-day window works well.
Once you’ve set these, just run the report. Amazon takes a few moments to process it, and then it will be ready to download as a CSV or Excel file right from that same page. Getting comfortable with this process is the foundation for managing your Amazon ads effectively.
Unlocking Insights From Your Search Term Report

If you only have time to look at one report, make it this one. The Search Term Report is, without a doubt, the most powerful tool in your PPC toolbox. Why? It shows you the exact words and phrases real customers are typing into Amazon’s search bar right before they click on your ad.
This isn’t just about keywords. It's a direct window into your customer's mind. You get to see what they want and how they look for it, which tells you exactly where your campaigns are hitting the mark—or missing it completely.
Finding Your Keyword Gold
The first thing most people do with this report is hunt for new, high-performing keywords, and for good reason. When you run automatic campaigns or use broad match keywords, you're essentially letting Amazon test the waters for you. Your job is to sift through the results and find the winners.
I always sort the report by orders or sales first. I want to see which search terms are actually making me money. When I find a customer search term that's led to two or more sales with a profitable ACoS, I immediately move it as an exact match keyword into a dedicated manual campaign. This gives me much tighter control over the bid for that proven term.
Eliminating Wasted Ad Spend
Just as important as finding what works is finding what doesn't. Your Search Term Report will always uncover clicks from irrelevant searches that are quietly draining your ad budget. Tackling these is the easiest, fastest way to improve your campaign performance.
For this, I filter the report to show terms with zero sales and then sort by spend from highest to lowest. Look for search terms that are just plain wrong for your product. For instance, if you sell a "silicone baking mat," you might find you’re paying for clicks on "silicone keyboard cover." Ouch.
The moment you find a costly, irrelevant search term, add it as a negative exact match keyword. This one simple action instantly stops your ad from showing for that query, preventing any more wasted spend. For broader mismatches, like a competitor's brand name, a negative phrase match is often a better choice.
Making this kind of cleanup a regular habit is essential. It directly improves your ACoS and makes sure your budget is focused only on shoppers who are actually looking for what you sell.
Optimizing Beyond Keywords
The value of the Search Term Report goes far beyond just managing keywords. The language customers use is a goldmine of information that can help you improve your entire product listing.
- Discover New Features: Are customers searching for a "BPA-free silicone baking mat"? If your product is BPA-free but you haven't mentioned it in your title or bullet points, you're missing out on a key selling point. Add it!
- Identify Different Use Cases: You might discover people are finding your product by searching for something you never considered, like a "craft clay work mat." This could uncover a whole new audience you can target with your images or A+ Content.
- Refine Your Language: Do shoppers use the term "non-stick" more often than "easy release"? Pay close attention to the common words and phrases. When you align your listing copy with the language your customers actually use, your click-through and conversion rates will almost always improve.
Diving into your Amazon advertising reporting, especially the Search Term Report, isn't a one-and-done task. It's a continuous cycle of discovery and refinement that will directly boost your profitability and growth on the platform.
Squeezing More Profit Out of Your Ads With Advanced Reports
Once you’ve got a handle on the Search Term Report, it’s time to dig into the reports that truly separate the top performers from the rest. While many sellers get stuck focusing only on ACoS, the real pros use advanced reporting to fine-tune every little detail, which has a massive impact on the bottom line. These reports tell you exactly where your ads are showing up, who's seeing them, and how you can tweak your bids for the best possible return.
This isn't just a "nice to have" skill anymore. The Amazon marketplace is getting more crowded by the day. Projections show Amazon could pull in a staggering $60.6 billion in retail media ad revenue by 2025. If you want your products to get noticed, you have to use every bit of data you can get your hands on. You can read more about Amazon's ad revenue growth from Advanced Television to see just how competitive it's getting.
Master Your Ad Placements
The Placement Report is one of the most powerful—and most overlooked—tools in your advertising arsenal. It literally shows you where on Amazon your ads are appearing and breaks down how they perform in each spot. This is a complete game-changer because an ad on top of the search results performs very differently than one on a competitor's product page.
You'll want to pay close attention to three main placements:
- Top of Search (First Page): These are the prime-time slots. They're the first ads shoppers see at the very top of the search results.
- Rest of Search: This covers all the other ad placements within the search results, like those in the middle of the page or on pages two, three, and beyond.
- Product Pages: These are the ads that appear on product detail pages—both yours and your competitors'.
I’ve lost count of how many times I’ve looked at a client’s account and seen fantastic results from "Top of Search" but a sky-high ACoS on "Product Pages." Once you download this report, you can see the hard numbers: the spend, sales, and ACoS for each placement. Armed with that knowledge, you can use Amazon’s "Adjust bids by placement" feature to bid up on your winning spots and pull way back on the ones draining your budget.
Refine Your Aim With The Targeting Report
Think of the Targeting Report as your performance review for every keyword, product (ASIN), or category you’re actively bidding on. The Search Term Report tells you what customers actually searched for; the Targeting Report tells you how the specific targets you chose are actually doing.
When I open this report, my goal is simple: find the winners and cut the losers.
A "winner" is a target that's hitting my ACoS goal and bringing in a good number of sales. I'll gently bump up the bids on these to get more eyeballs and, hopefully, more sales. A "loser" is a target that’s getting plenty of clicks (and spending my money) but isn't converting. These either get their bids slashed or are paused completely.
For instance, let's say you're targeting a competitor’s ASIN and you've spent $50 on clicks without a single sale. It's time to cut it loose. On the flip side, if you find a broad match keyword that’s humming along at a 15% ACoS, that's a bright green light to invest more heavily. This constant process of pruning and feeding is what keeps your ad spend flowing to the most profitable parts of your campaigns. Making this report a regular part of your routine is a fundamental discipline for anyone serious about Amazon advertising.
Turning Your Reporting Data Into Action

Let's be honest: staring at a spreadsheet full of advertising data is only the first step. The real magic happens when you translate those numbers into smart decisions that actually improve your campaigns. This is where your ad spend starts to pull its weight and deliver real results.
Think of yourself as a detective. Every metric is a clue, telling you a story about your ads, your products, and your customers. The goal isn't just to see the numbers, but to figure out what they're trying to tell you and then act on it.
A classic example I see all the time is a high click-through rate (CTR) but a disappointingly low conversion rate. That's a huge clue. It tells me your ad creative is doing its job—it's grabbing attention and earning clicks. But something is falling apart once shoppers land on your product page. This isn't an ad problem; it's a listing problem.
With the marketplace growing more competitive every day—you can see just how much in Marketplace Pulse's report on Amazon's ad sales—you can't afford to just "set it and forget it." You have to constantly refine your strategy.
Creating Your Action Plan
To move from just looking at data to making real, profitable changes, you need a plan. Let's walk through a few common scenarios you'll spot in your reports and what to do about them. This framework will help you stop guessing and start making confident, data-backed adjustments.
Scenario 1: High CTR, Low Conversion Rate
You’ve got a ton of clicks, but very few sales. This is a classic sign of a disconnect between your ad's promise and the reality of your product detail page.
Here’s your troubleshooting checklist:
- Review Your Listing: Is the main image, title, and price on the ad an exact match for what's on the product page? Any small difference can create friction and kill the sale.
- Check Your Reviews: A sudden drop in your star rating or a fresh, prominent negative review can absolutely tank your conversion rate overnight.
- Analyze Competitiveness: Is your price suddenly way higher than similar products on the page? Shoppers are pros at comparison shopping.
- Improve Your Content: Are your bullet points and A+ Content truly selling the product? Use them to answer common questions before they're asked and highlight the benefits that matter most.
Scenario 2: Low Impressions & Low Clicks
Your ads aren't even getting a chance because nobody's seeing them. This is almost always a visibility issue, typically caused by bids that are too low or targeting that's way too narrow.
Here's how to fix it:
- Increase Your Bids: You might be getting outbid for the best ad placements. Try nudging your bids up incrementally on your most important keywords and see what happens.
- Broaden Your Targeting: If you’re only using exact match keywords, you're likely missing out on a huge chunk of potential customers. Experiment with phrase or broad match keywords to cast a wider net.
- Check Your Keywords: Are you even targeting terms people are searching for? Use a good keyword research tool to make sure your keywords have enough search volume to be worthwhile.
The biggest wins often come from solving these seemingly small puzzles. I once had a client with a keyword that had a fantastic 12% ACoS but was only getting a few impressions each day. We dug in and realized our bid was just cents below the threshold for a top-of-search placement. By increasing the bid by a tiny $0.15, impressions shot up 400%, and it became their single most profitable keyword almost instantly.
When you start treating your reports like a diagnostic tool, you build a repeatable process for improvement. Each time you pull a report, you have a new chance to spot a problem, test a solution, and measure the results. That's how you systematically drive your campaigns toward greater performance and profitability.
Common Amazon Reporting Questions
It doesn't matter if you're a seasoned pro or just starting out—everyone runs into the same handful of questions when digging into Amazon advertising reports. From data that just doesn't seem to line up to the age-old mystery of what a "good" metric actually is, these hurdles can be frustrating.
Let's clear the air and tackle these common questions head-on. Getting a handle on these nuances is the key to building confidence in your analysis and, more importantly, making smarter, more profitable decisions for your campaigns.
How Often Should I Be Looking at My Reports?
This is a classic. The truth is, there’s no single right answer, but you can definitely get it wrong. Check too often, and you'll drive yourself crazy reacting to every little blip. Check too rarely, and you'll miss costly issues until it's too late.
Based on my experience, here’s a practical rhythm that works for most sellers:
- A Weekly Health Check: At a minimum, you should be pulling your Search Term Report once a week. This is your front line for catching irrelevant search terms that are wasting your ad spend. Think of it as basic campaign hygiene—it keeps your account clean and efficient.
- A Deeper Dive Every 2-4 Weeks: This is where the real strategy happens. Block out some time every couple of weeks (or at least monthly) to go deeper. This is when you'll pore over your Placement, Targeting, and Purchased Product reports to spot bigger trends, adjust your bids, and make strategic budget shifts.
What’s a Good ACoS?
Ah, the million-dollar question. And the most honest answer is: it depends entirely on your business. A "good" Advertising Cost of Sale (ACoS) is completely tied to your product's profit margin and what you’re trying to achieve right now. An ACoS that's amazing for one brand could be a complete disaster for another.
The best starting point is to work backward from your profit margin. If your product has a 40% profit margin before you factor in advertising, then your break-even ACoS is 40%. Anything under that, and you're making money on each ad-driven sale.
But your strategy changes everything:
- Launching a new product? You'll probably be willing to stomach a much higher ACoS—maybe even one that loses money on paper—to get those first crucial sales, build up reviews, and gain ranking momentum.
- Managing a mature, best-selling product? Your goal shifts to pure profitability. You’ll be aiming for a much lower ACoS to maximize your returns.
Forget about industry benchmarks for a minute. The only ACoS that truly matters is the one that aligns with your specific product's profitability and your current business goals. Calculate your break-even point and make that your north star.
Why Don’t My Report Sales Match My Business Sales?
This one trips up everyone. You look at your advertising dashboard, see one sales number, then check your main Seller Central business reports and see another. It’s incredibly common, and it almost always comes down to two things: data lag and attribution windows.
First, Amazon's ad data isn't instant. It can take up to 72 hours for all sales and click data to be fully processed and show up in your reports. A sale that happens on Tuesday might not appear in your ad campaign data until Thursday or Friday.
Second, you have to consider the attribution window. With a standard 7-day click window, a customer might click your ad on Monday but not actually buy the product until Friday. Amazon will credit that sale back to the click on Monday, which can make daily numbers look inconsistent. This is why it’s always better to analyze performance over longer date ranges, like a full week or a month, to get a much more stable and accurate picture.
At Headline Marketing Agency, we transform complex data into clear, actionable growth strategies. If you're ready to move beyond basic metrics and unlock the full potential of your Amazon advertising, let's talk. Learn more about our data-driven approach at https://headlinema.com.
Get Your Free Amazon PPC Audit
Discover untapped growth opportunities and see how our data-driven approach can improve your ROAS.
Get Free Audit →Ready to Transform Your Amazon PPC Performance?
Get a comprehensive audit of your Amazon PPC campaigns and discover untapped growth opportunities.