Brand Equity Tracking for Amazon Growth
Master brand equity tracking on Amazon. Learn to measure search demand, leverage AMC datasets, and design experiments that drive sustainable organic growth.


The most popular advice about brand equity tracking is to survey customers regularly and watch awareness, consideration, and preference. That's useful, but it's not enough to manage an Amazon business. A stronger survey result doesn't tell you whether your next advertising dollar will build organic demand or claim credit for a purchase you would've received anyway.
For Amazon leaders, the better starting point is marketplace behavior, supported by consumer research and controlled experiments. Track what shoppers search for, where they encounter your products, and whether demand holds after paid exposure changes. Then use those findings to make budget decisions based on profitable growth, not a cleaner attribution report.
Why Traditional Brand Tracking Fails on Amazon
A quarterly awareness study can answer whether more category buyers recognize your brand. It can't explain whether yesterday's conversion decline came from weaker preference, an unavailable variation, or a competitor's promotion. Those questions require different evidence.
The mistake isn't using surveys. It's asking surveys to serve as an operating dashboard, then using last-touch advertising reports to fill the gaps.
Separate brand perception from marketplace conditions
Brand equity tracking measures durable changes in how shoppers recognize, evaluate, and choose your brand. Amazon performance reporting measures transactions and the conditions surrounding them. Treating either as a complete substitute for the other creates bad decisions.
A brand can generate more sales because it's easier to find, not because shoppers prefer it more. Conversely, strong preference won't rescue an unavailable product. Your measurement system needs to distinguish those situations before anyone changes the media plan.
A 2025 Journal of Business Research article on digital brand equity argues for combining share of search, digital awareness, and digital sentiment with human and technology-consumer factors, rather than relying only on social-media indicators. That's a useful direction for Amazon: connect what shoppers think with what they do.
For social operations teams building the listening component, Sift AI's brand health tracking framework for social ops is a supplementary resource. Keep that work connected to marketplace outcomes rather than treating conversation volume as proof of demand.
Build a system with different measurement speeds
Use a layered operating model:
- Behavioral monitoring: Review Search Query Performance, advertising exposure, listing engagement, and availability to investigate immediate changes.
- Commercial validation: Examine organic discoverability, repeat buying, and contribution after advertising to assess whether growth is durable.
- Attitudinal checks: Use consistent awareness, preference, and perceived-quality research to understand changes that transaction data can't explain.
The trade-off is complexity. A survey-only program is easier to summarize, while a behavioral dashboard can tempt teams into reacting to every fluctuation. Assign each dataset a specific job and a decision owner.
Practical rule: Use fast data to identify a question. Use independent evidence to decide whether the answer deserves a budget change.
Don't replace an expensive, slow tracker with a fast, misleading one. Keep consumer research as validation, but put Amazon-native evidence closer to daily trading decisions.
Core Metrics for Measuring Amazon Brand Health
Amazon visibility matters because shoppers don't evaluate every available product. NielsenIQ's Amazon search analysis found that approximately 80% of products added to baskets appear within the first 10 search results for the relevant keyword; Sponsored Product Ads represent approximately 85% of Amazon's purchased ads, with effectiveness similar to highly ranked unpaid results.
The implication isn't to buy every prominent placement. It's to evaluate whether paid visibility helps you earn a stronger commercial position.
Organize the dashboard around related signals, not isolated campaign metrics.
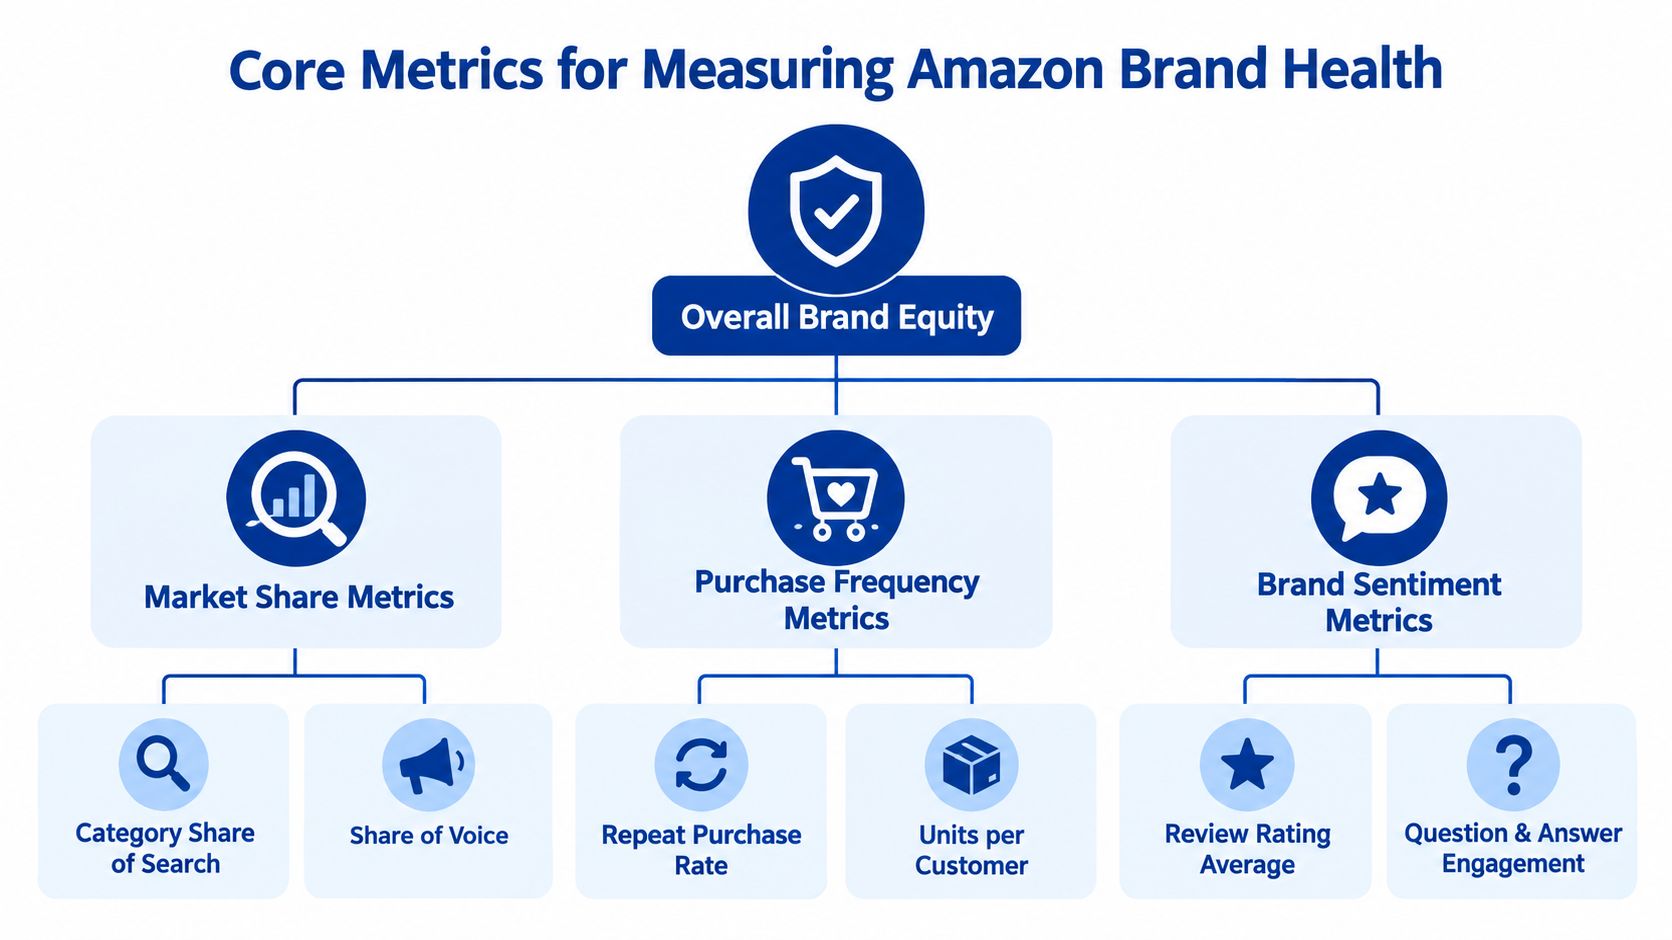
Make SQP useful at the query level
Use Search Query Performance (SQP) to investigate where your brand participates in shopper demand. Maintain separate query groups for branded terms, highly relevant nonbranded terms, and broader category searches.
For each group, examine available impression, click, cart-add, and purchase measures together. A stronger purchase share without a comparable improvement in impression share points toward a different opportunity than increased visibility without purchases.
Keep the denominator explicit. Your brand's purchase share on a selected query set isn't automatically its market share across the entire category. Likewise, a query appearing in your report doesn't make it representative of all category demand.
| Signal | Decision it supports | What it doesn't establish alone |
|---|---|---|
| Branded-query demand | Whether shoppers increasingly seek the brand | Incremental advertising impact |
| Nonbranded purchase share | Where the brand wins category shoppers | Brand preference independent of price |
| Sponsored and organic rank | Whether visibility depends on paid placement | Profitable demand |
| New-to-brand measures | Whether measured acquisition is expanding | Lifetime customer value |
| Repeat purchase | Whether buyers return | Loyalty independent of replenishment needs |
Keep scale effects out of the brand story
A larger brand naturally has more opportunities to generate searches, reviews, and repeat orders. Compare rates and shares alongside absolute volumes, and separate prior buyers from prospective customers where the available data allows.
Pair the query view with total revenue, organic rank, review themes, and advertising cost relative to total sales. Define blended ACOS or TACOS explicitly so finance and media teams aren't interpreting different denominators.
Review sentiment also needs context. Read the underlying themes rather than treating the average rating as a complete measure of perceived quality.
The actionable question is whether shoppers increasingly choose your brand under comparable conditions. More impressions are useful only when the resulting demand justifies their cost.
Designing Experiments to Prove Organic Lift
PPC becomes a growth investment when you can connect additional paid exposure with demand beyond attributed orders. A simple before-and-after comparison can reveal a promising pattern, but it doesn't isolate advertising from seasonality, pricing, or competitor activity.
A reported Hydrant Sponsored Ads experiment linked a 30-day coordinated strategy with a 104% increase in daily organic sales, a 40% improvement in organic rank, and Top-of-Search Share of Voice rising from 0% to 25%. Those results illustrate the mechanism worth testing, not a forecast for another brand or definitive proof of causality.
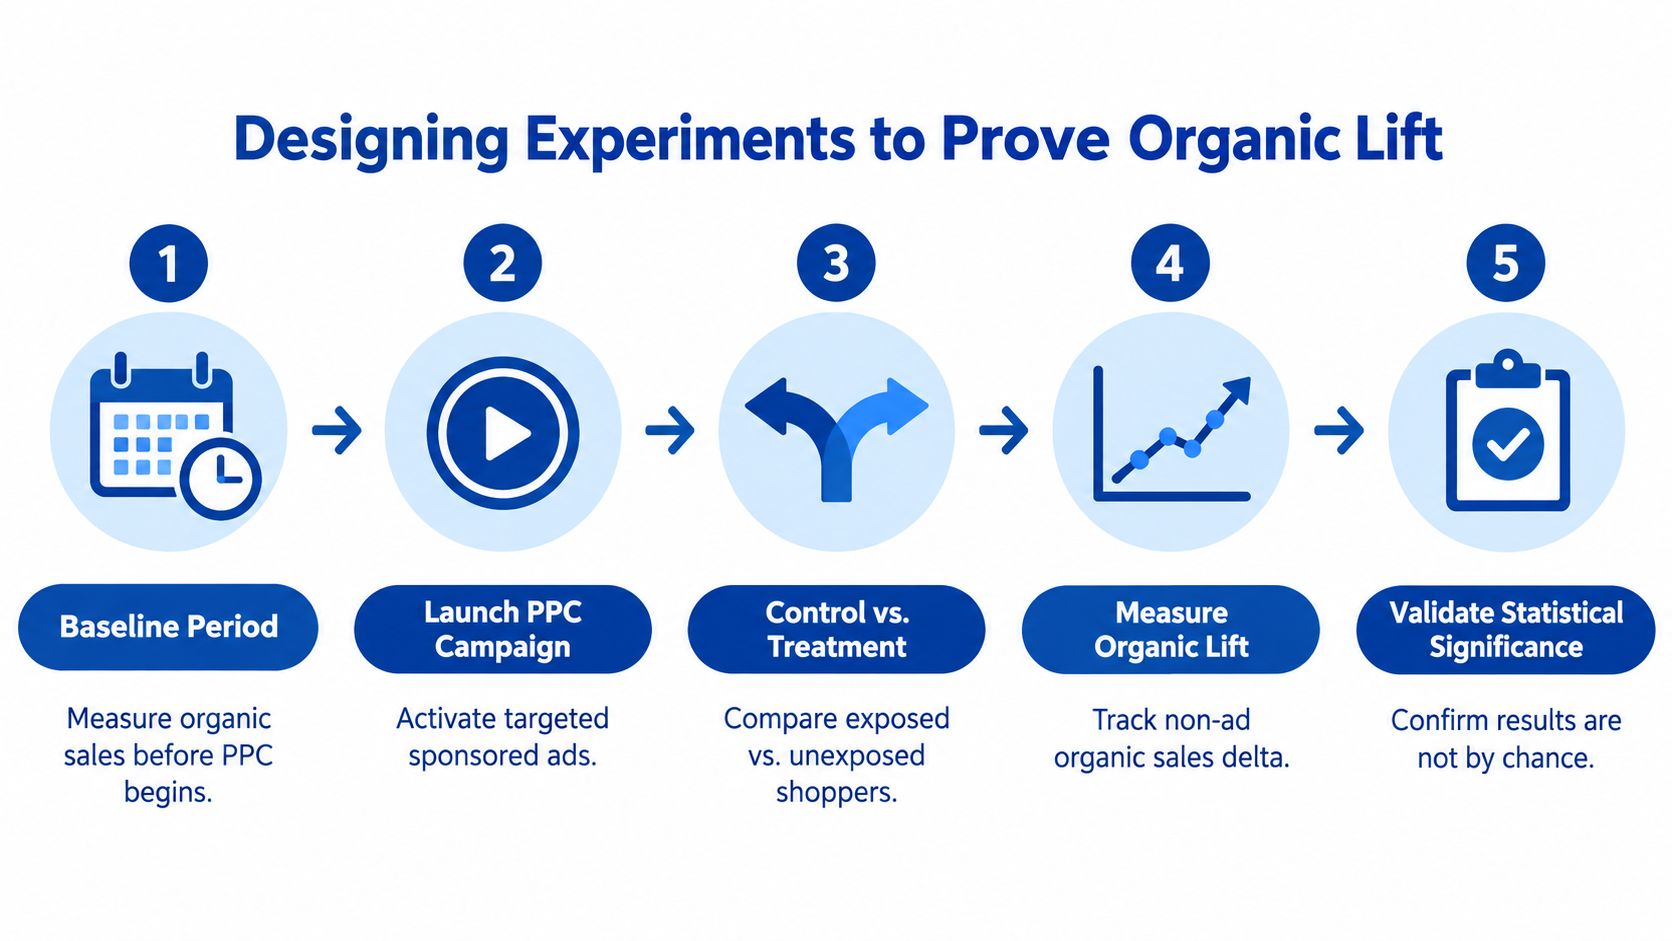
Use the workflow below as a starting point, with a stronger counterfactual wherever practical.
Establish the test before changing bids
Choose a narrow commercial hypothesis. Specify the query cluster, advertised ASINs, and expected downstream outcome. For example, test whether increased exposure on highly relevant nonbranded searches improves subsequent unpaid discoverability profitably.
Record a comparable baseline. Capture total sales, reported attributed sales, organic rank, sponsored share of voice, BSR, price, availability, and review conditions. Avoid starting from an abnormal stockout or promotional period.
Create a credible comparison. Use a holdout where feasible, or select comparable untreated products or query groups. Document differences that could invalidate the comparison, including advertising spillover between related products.
Change the intended lever. Keep listing content, promotions, and pricing stable where practical. If several commercial inputs change together, evaluate the combined intervention rather than claiming a pure PPC effect.
Evaluate persistence and economics. Compare treatment movement with the control, account for uncertainty, and inspect what happens after the additional exposure ends.
For another perspective on defining the counterfactual, consult FindClout on measuring ad growth. The useful discipline is distinguishing observed growth from growth caused by the intervention.
Don't manufacture an organic-sales number
Subtracting attributed advertising sales from total sales can provide a working estimate of unattributed sales. It doesn't automatically produce a clean organic-sales measure, especially when reporting windows and attribution rules differ.
Align reporting periods, document the calculation, and label the estimate. SQP can help locate query-level changes, while independent rank observations and ASIN-level economics provide corroboration.
A pre/post result is a reason to investigate. A credible control and a profitable, persistent effect are reasons to scale.
Set the success criteria before launch. Otherwise, teams can always find a favorable metric after the fact.
Leveraging Amazon Marketing Cloud for Full-Funnel Insight
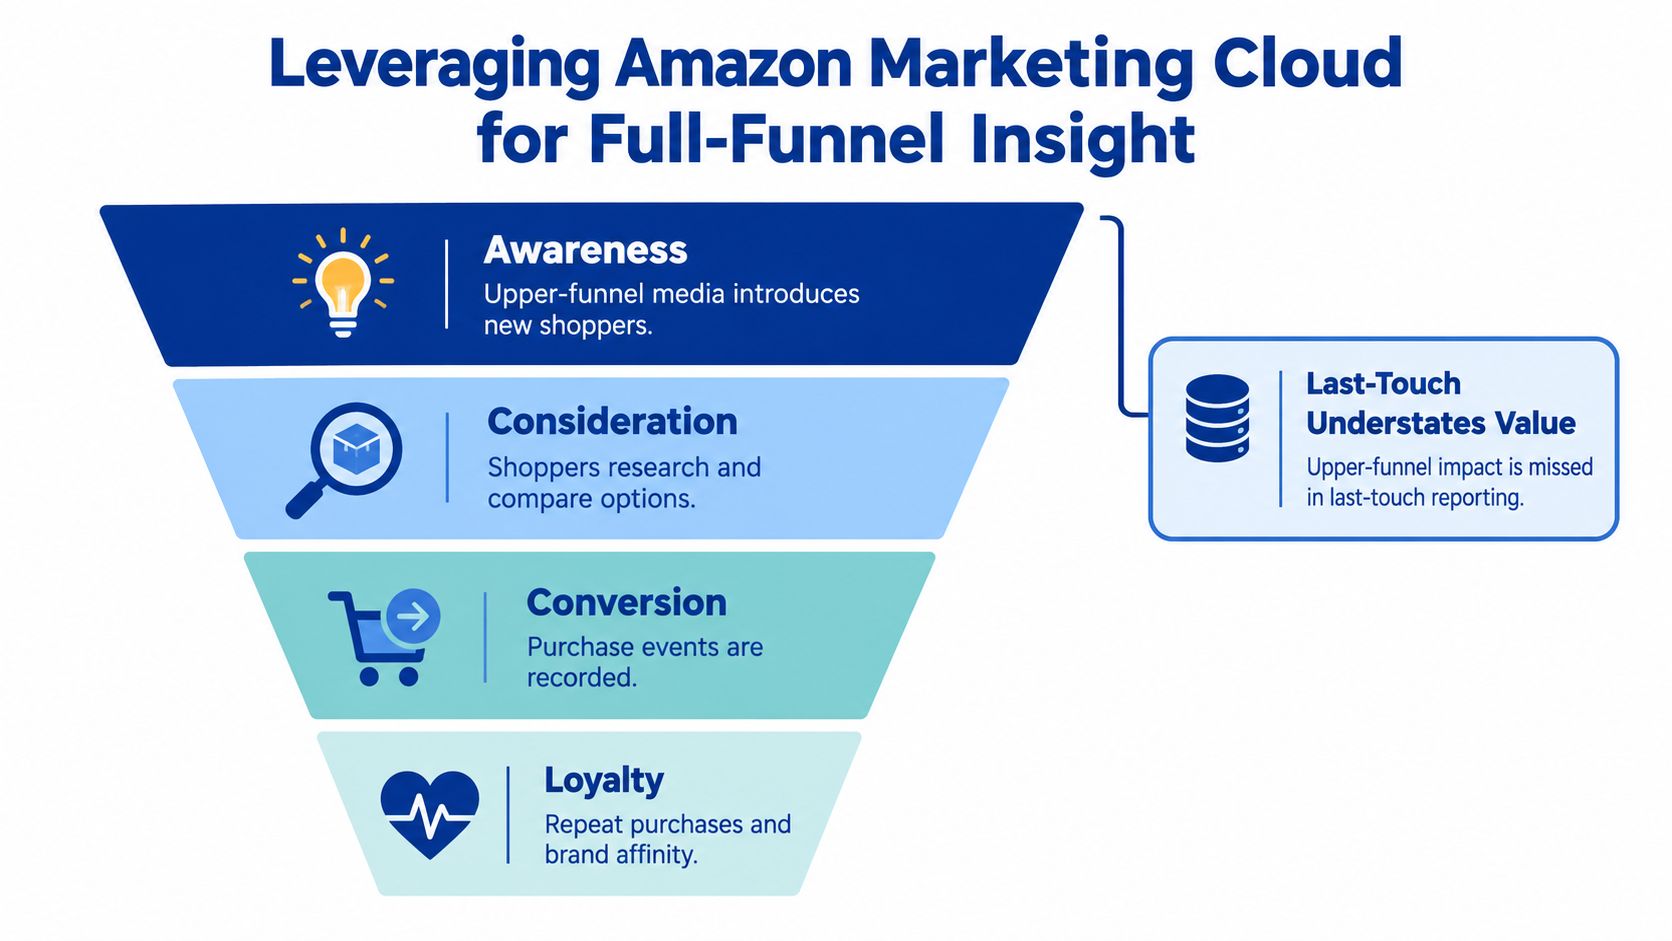
Last-touch attribution answers a narrow question: which eligible interaction received credit for the purchase? It doesn't establish which exposures introduced the shopper, changed consideration, or caused incremental demand.
That distinction matters when deciding whether to retain upper-funnel investment. Cutting media because it rarely receives final credit can remove valuable reach, but retaining it because exposed shoppers convert well is equally weak reasoning.
Use the funnel to organize questions, not to assume that every shopper follows the same sequence.
Use AMC to distinguish reach from influence
An Amazon Marketing Cloud consumer-packaged-goods case study found that 92% of the streaming-TV audience was net new relative to existing Amazon DSP campaign audiences. Shoppers exposed to both streaming TV and display were twice as likely to purchase as those exposed to only one media type.
The qualification matters: net-new reach relative to another campaign audience isn't necessarily new-to-brand acquisition. Similarly, stronger purchasing among multiply exposed shoppers is an association, not automatic evidence of incremental lift.
Build AMC analysis around explicit comparisons:
- Reach expansion: Identify how much additional audience a channel contributes beyond existing media.
- Exposure overlap: Compare single-channel and combined-exposure groups using consistent eligibility and observation windows.
- Purchase paths: Examine exposure sequence, time to purchase, and measured downstream outcomes.
- Incrementality: Use an appropriate experiment to test whether the observed relationship reflects a causal effect.
Connect audience evidence with marketplace evidence
Use AMC to investigate exposure and conversion paths, then compare the relevant periods with SQP demand patterns. Don't imply that an aggregate query trend identifies the same individual shoppers in an AMC audience.
The stronger business case combines an experimental result with compatible marketplace evidence and acceptable acquisition economics. If those disagree, investigate rather than averaging them into a reassuring score.
For additional context on the platform, use this accompanying video.
AMC supports better questions; it doesn't remove the need for experimental design. Allocate budget according to the strength of the evidence and the economics of the incremental customers, not exposure-path storytelling alone.
Scaling Budgets Based on Durable Marketplace Demand
Rosy Soil's expansion illustrates a more disciplined sequence than launching broad targeting and hoping conversion catches up. The brand began with exact-match Sponsored Products campaigns around cactus and succulent keywords, then expanded toward broader head terms and Amazon DSP after building its marketplace position.
The Rosy Soil case study reports 344% year-over-year monthly revenue growth by March 2026, a 13.5% decrease in ad spend, a 25% conversion rate, and garden-soil BSR improving from #41 to #8. These are reported case outcomes, not universal benchmarks or evidence that every improvement came from advertising alone.
Expand from relevance, not ambition
The useful lesson is sequencing. Start with searches where the product, listing, and shopper need align closely enough to support conversion. Use that environment to learn which claims, images, and offers help shoppers choose the product.
Broader category terms introduce a different trade-off: more potential reach, but less certainty that every shopper wants your specific proposition. DSP introduces additional audience and measurement considerations. Neither should become the default destination for leftover budget.
Before expanding, ask whether the existing demand is commercially healthy.
| Expansion gate | Evidence to inspect | Reason to pause |
|---|---|---|
| Listing readiness | Availability, variation clarity, product content | Additional traffic reaches a weak offer |
| Conversion strength | Performance on relevant queries and stable offers | Sales depend on repeated discounting |
| Marketplace position | Organic visibility and query-level purchasing | Growth requires continually buying more exposure |
| Customer experience | Review themes and product expectations | Acquisition amplifies unresolved problems |
| Unit economics | Contribution after ads, fees, and other variable costs | Revenue growth consumes margin |
Set thresholds from your own category economics and historical performance. Copying another brand's conversion rate ignores differences in price, purchase frequency, competitive intensity, and margin.
Protect the economics after expansion
Keep proven campaigns visible in reporting when you introduce broader targeting. Otherwise, strong performance from established demand can conceal weak economics in the expansion cohort.
Inspect marginal results rather than relying only on account averages. Ask what the additional spend produced, whether organic visibility held, and whether the next cohort of customers remained economically attractive.
Budget discipline: Scale the opportunity that has earned more investment, not the campaign that makes the account look bigger.
Lower ad spend alongside higher revenue is encouraging, but it doesn't establish improved profitability without cost and margin evidence. For Headline's performance-first approach, the objective is sustainable contribution and a stronger marketplace position, not revenue growth at any price.
Governance Rules for Reliable Brand Measurement
The most dangerous dashboard isn't incomplete. It's precise-looking, frequently updated, and easy to misinterpret.
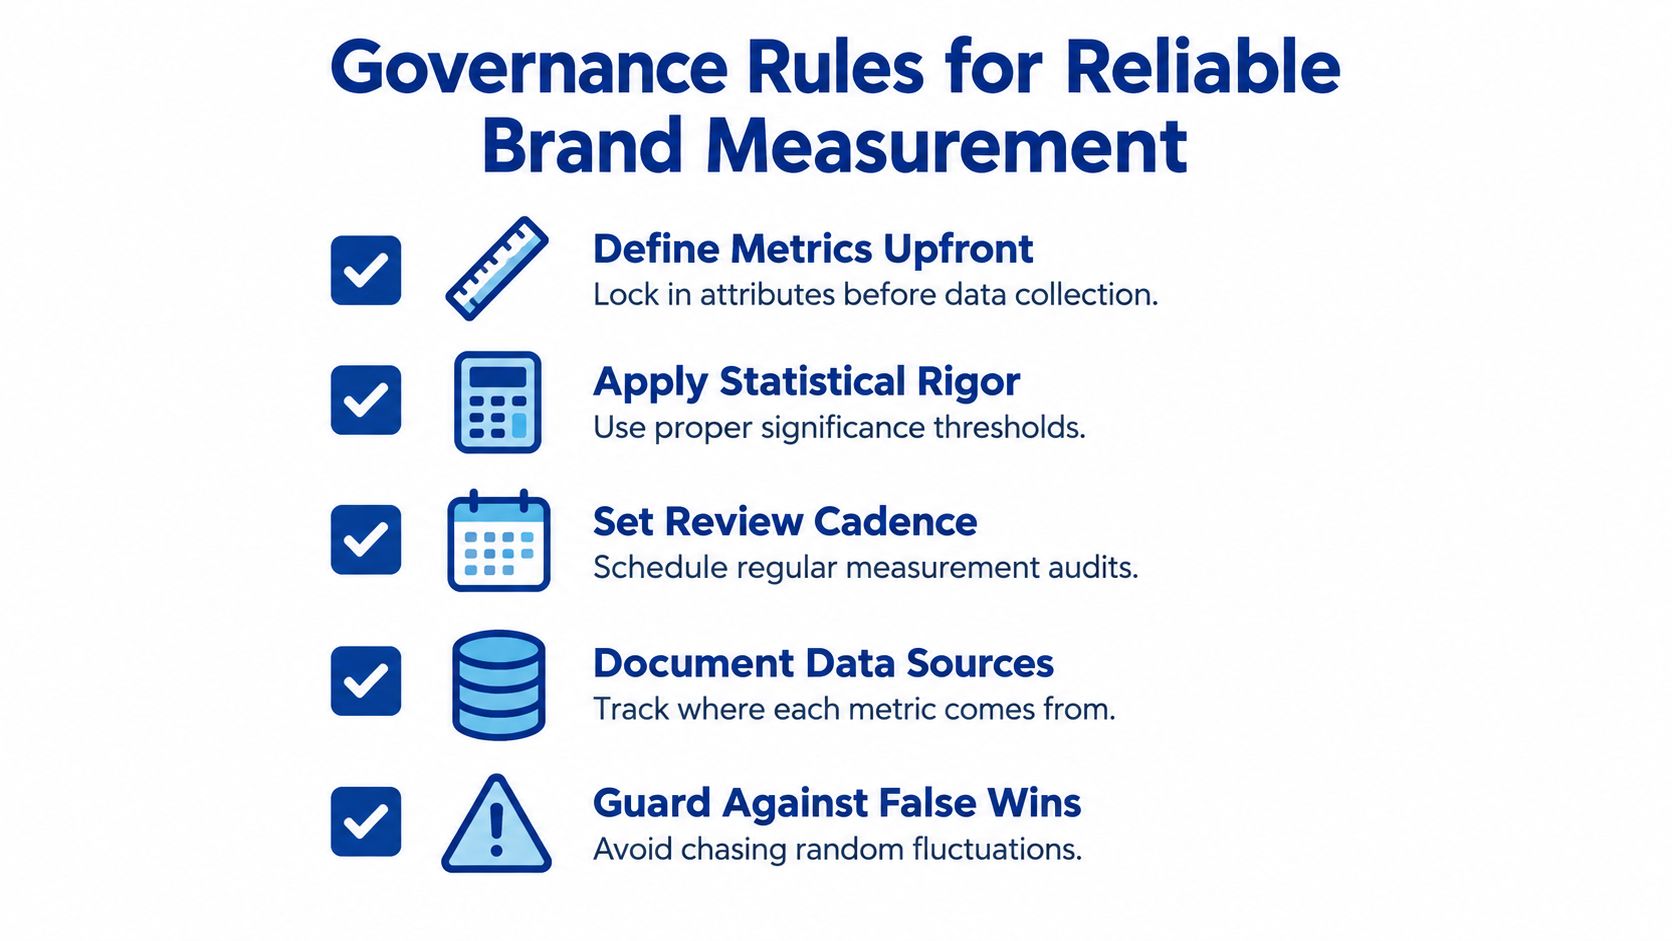
Brand equity tracking needs governance because teams can find apparent progress by changing query sets, selecting favorable periods, or inspecting enough metrics. A reliable system makes those choices visible before anyone presents a win.
Use this checklist as an operating standard, not just a reporting exercise.
Lock definitions and decision rules
- Document each metric: Specify its source, calculation, attribution window, query universe, exclusions, and owner. Record changes instead of overwriting definitions without notice.
- Separate alerts from conclusions: Treat unexpected behavioral movement as an investigation trigger. Require corroborating evidence before labeling it a durable equity shift.
- Predefine action thresholds: Set the minimum commercially meaningful change and the evidence required to increase, maintain, or reduce investment.
- Record commercial context: Annotate availability problems, promotions, listing changes, and major price movements so reviewers can challenge alternative explanations.
If surveys remain part of the program, preserve the target population, core wording, and sampling approach. Sogolytics' brand-perception survey guidance supports consistent recurring measurement and sizing research around actionable change rather than choosing a sample because it fits the budget.
Test reliability without confusing it with causality
For multi-item consideration or preference measures, Cronbach's alpha of at least 0.70 is a conventional threshold; testing many attributes at 95% confidence can generate chance wins without corrections such as Holm or Benjamini–Hochberg, as discussed in Listen Labs' brand-tracking methodology guidance.
Apply internal-consistency testing to constructs that fit. A dashboard containing search share, revenue, and review ratings is not a questionnaire scale and should not be treated as one. Reliability also does not establish that advertising caused the change.
Assign confirmatory metrics to major investment decisions and label exploratory findings separately. When a subgroup is too small or an observation window too short, report the result as directional instead of forcing a confident conclusion.
Finally, require every review to end with a decision and an owner. That might mean investigating a query cluster, fixing a listing problem, extending a test, or holding spend steady. The value of measurement is the quality of the next commercial decision, not the volume of charts produced.
Headline Marketing Agency offers Amazon PPC and DSP management supported by SQP analysis, AMC insights, and data-backed experiments focused on profitability and organic growth. Visit Headline Marketing Agency to discuss a measurement plan that tests where advertising creates incremental demand and sets clear evidence gates for scaling your budget.
Get Your Free Amazon PPC Audit
Discover untapped growth opportunities and see how our data-driven approach can improve your ROAS.
Get Free Audit →Wollen Sie Ihre Amazon PPC-Performance aufs nächste Level bringen?
Lassen Sie Ihre Amazon PPC-Kampagnen professionell analysieren und entdecken Sie neue Wachstumsmöglichkeiten.