Amazon Marketplace Strategy: A Profit-First Growth Framework
Build a data-driven amazon marketplace strategy that turns paid spend into organic rank and sustainable profit, with full-funnel media, AMC, and testing

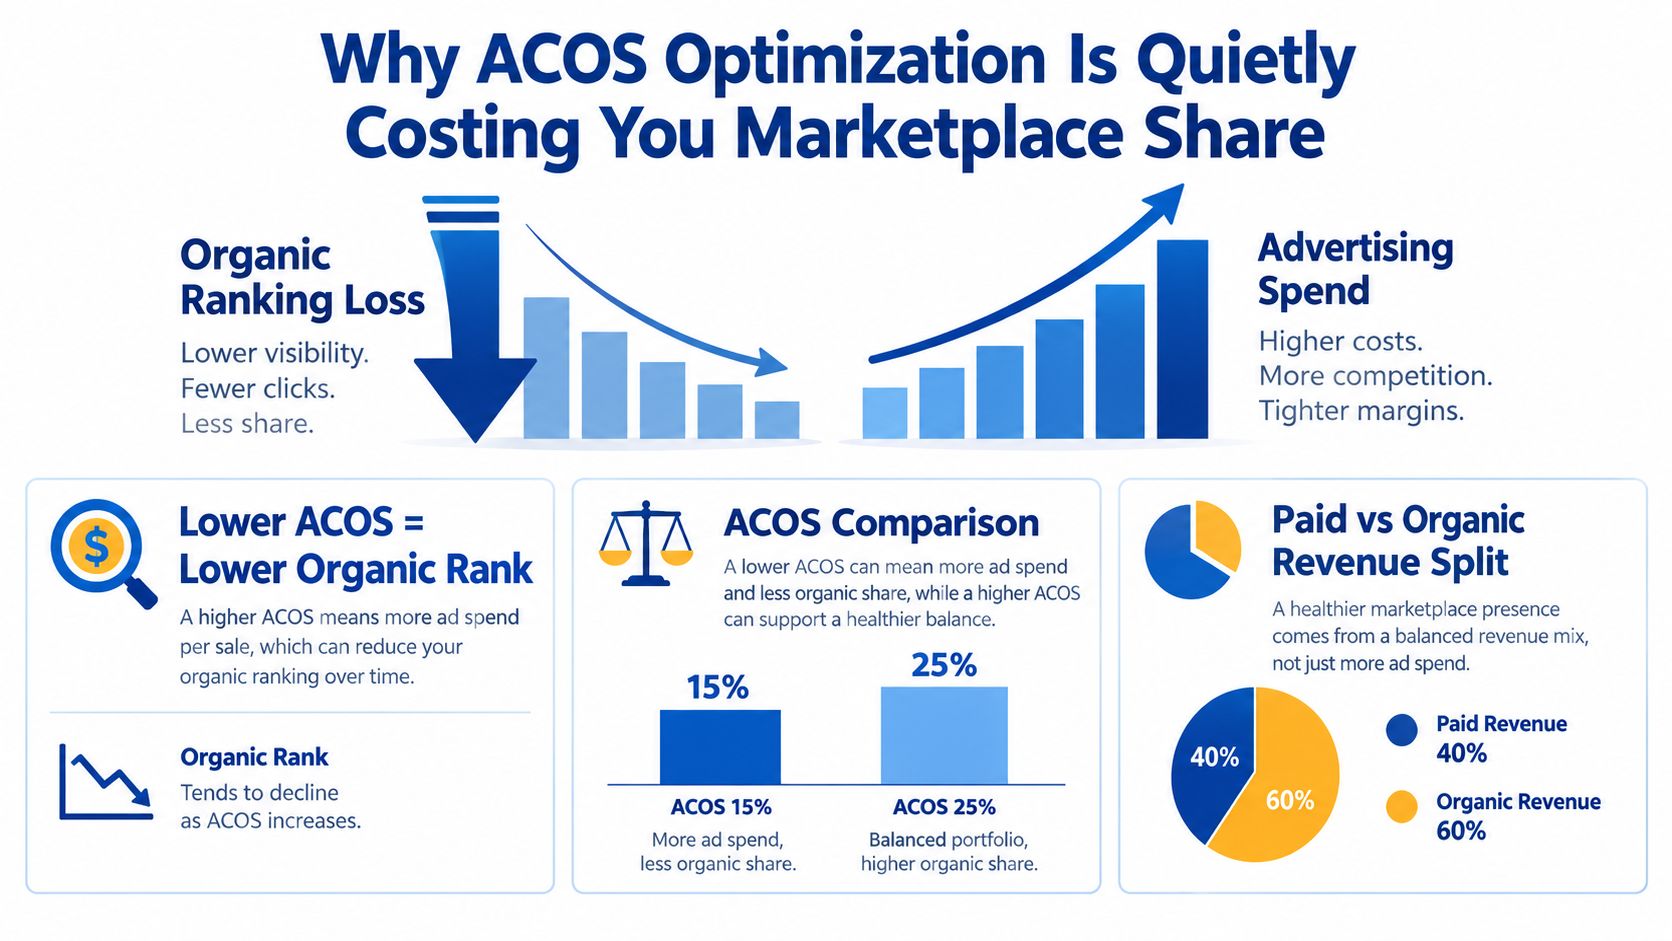
Cut your ACoS. That's the advice most Amazon sellers hear first, and it's the advice that shrinks good brands. A lower ACoS can mean you bought cheaper clicks, stopped learning which queries create customers, and ceded rank to a competitor willing to pay for visibility while you protected a ratio. A serious Amazon Marketplace strategy doesn't start with a target ACoS. It starts with contribution profit, retail readiness, and proof that paid traffic improves your organic position. Treat PPC as a lever for rank, new customers, and durable share, not as a cost line to squeeze in isolation.
Why ACOS Optimization Costs You Marketplace Share
In accounts I rebuild, the pattern is rarely bid management. It is judging every campaign by last-click efficiency, even when its role is discovery, defense, or rank building. Cutting those campaigns can improve ACoS for a week. Then impressions thin out, competitors capture branded and category searches, and reclaiming lost positions costs more.
Competition is structural. Amazon reported that more than 60% of sales in its store came from independent sellers in 2023, and more than 10,000 sellers exceeded $1 million in annual sales for the first time. That means competing not only with familiar brands, but also with lean operators who manage fees, inventory, and paid search closely enough to stay active on profitable queries.
Profit remains possible, but ACoS alone cannot show whether a campaign is creating it. Amazon reports that 57% of sellers and SMBs and 81% of enterprise brands and retailers surveyed achieved net margins above 10%. That gap matters. It points to differences in unit economics, inventory discipline, and campaign roles, not dashboard design.
Three Costs an ACoS Target Hides
- Rank decay: Cutting paid visibility can reduce sales velocity on strategic queries and weaken the organic positions you want to retain.
- Margin distortion: A campaign may post an attractive ACoS while sending traffic to discounted, return-prone, or low-margin ASINs that erode contribution profit.
- Demand capture bias: Branded campaigns can report efficient ACoS while mostly converting shoppers who already know the brand. The account looks healthy, but category demand may go to competitors.
A campaign is not efficient if it saves ad spend but gives up search positions that could have produced organic sales later.
Judge spend by its business effect, not the ratio alone. Search Query Performance can show how the brand earns impressions, clicks, and purchases across relevant queries, helping identify where visibility or conversion share is slipping. Amazon Marketing Cloud (AMC) can add a view of how ad exposures and purchases connect across the funnel, rather than treating the last click as the entire story. Use those signals alongside contribution profit to distinguish incremental demand from sales that likely would have happened anyway.
Before cutting a campaign, ask what it protects, what it teaches, and whether the orders remain profitable after fees, fulfillment, returns, and discounts.
A Profit-First Operating Model Built on Baselines
Start with unit economics by ASIN, not account averages. Calculate break-even ACoS from selling price minus product cost, Amazon referral fees, fulfillment, storage, returns, discounts, inventory financing, and other variable costs. That number is your ceiling for harvesting activity. It isn't a universal target for every campaign, because a discovery campaign and a branded defense campaign do different jobs.
This funnel shows how each cost layer narrows the spend you can afford before profit disappears.
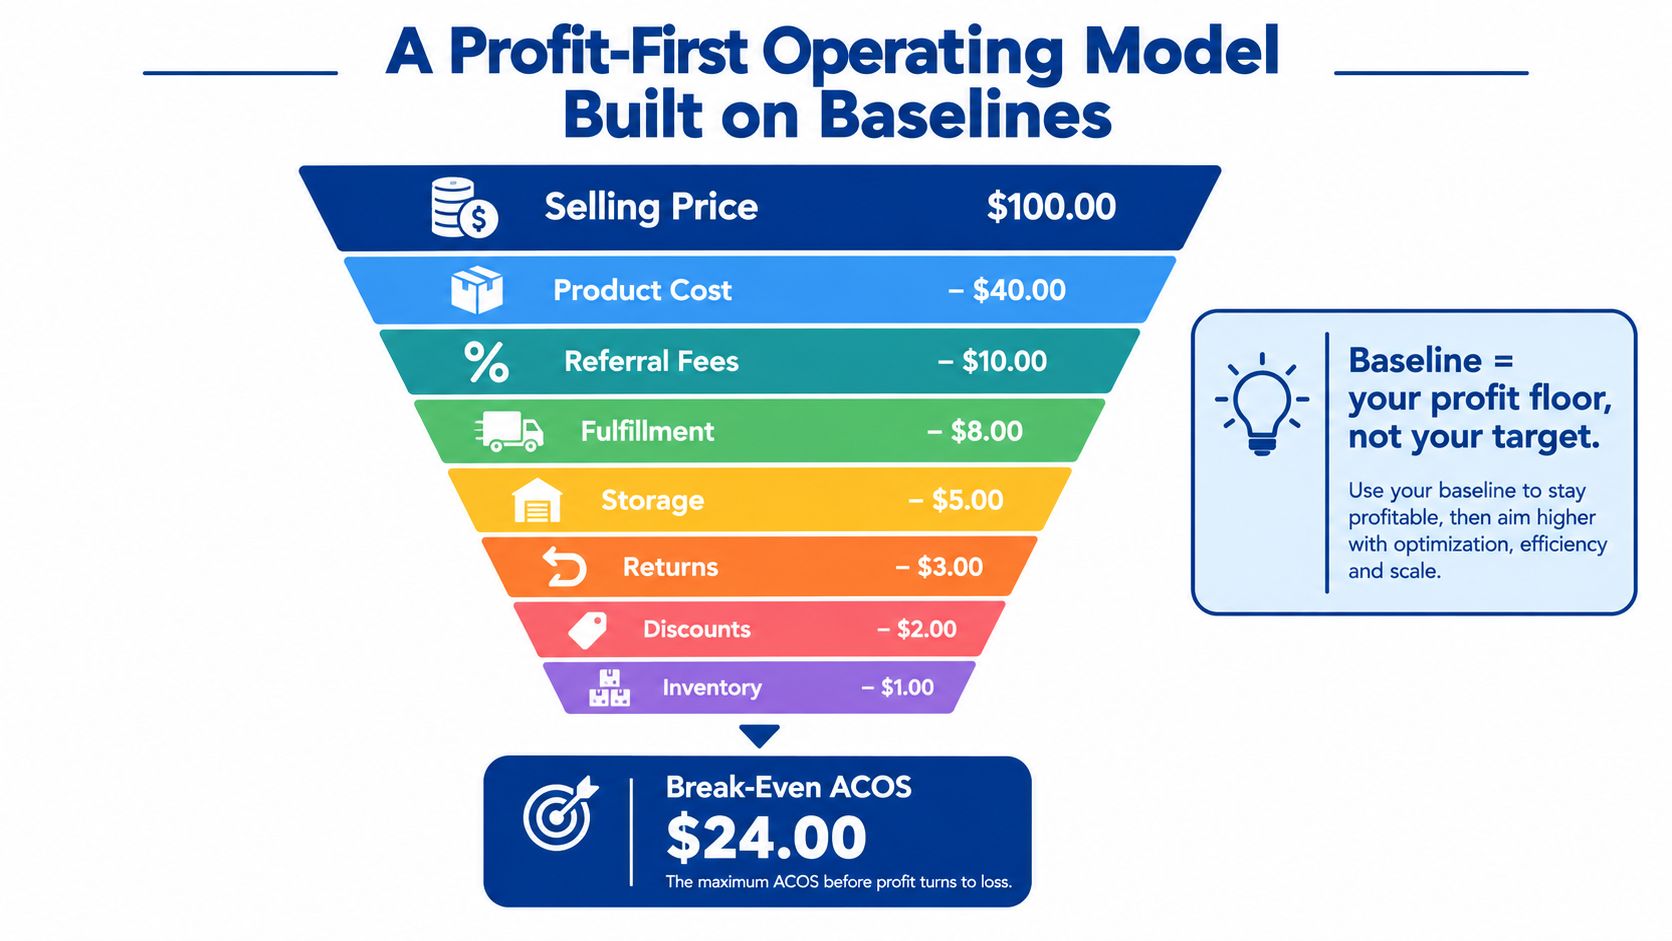
If you haven't translated margin into a usable advertising guardrail yet, a break even ROAS calculator can help you sanity check the math before you convert it into bid ceilings and campaign budgets. Do the work ASIN by ASIN. A portfolio average hides the hero product that can fund rank building and the weak variant that loses money at almost any CPC.
Assign Every Campaign a Job
Use four roles and judge each one differently. Harvesting captures proven, high-intent queries and must respect margin closely. Discovery tests new category terms and ASIN targets, so you assess query quality, click-through rate, and conversion signals before declared efficiency. Defense protects branded terms and your own detail pages where competitors can intercept demand. New-customer acquisition earns more tolerance when it produces verified new-to-brand demand, but only within a pre-set contribution limit.
Record a rolling baseline at ASIN and campaign level using the recent 28-day period as the active window and a 90-day trend for context. Track impressions, clicks, CTR, CPC, attributed conversion rate, ACoS, TACoS, Search Query Performance visibility, organic rank, price, Buy Box status, inventory coverage, and listing changes. Daily movement is mostly noise. Investigate sustained deviations and explain them with price, stock, competition, or creative changes before touching bids.
The video below is useful context for how this baseline thinking replaces reactive bid changes with planned decisions.
Use Peer Benchmarks as Diagnostics
Amazon's methodology is useful because it constrains the comparison. It requires matching campaigns by ad format, objective, product type, and operational status, with at least five peer brands and any single advertiser capped at 49% of spend weight. Apply it separately to CTR, CPC, purchase rate, new-to-brand purchase rate, CPM, and video completion rate.
Diagnose in funnel order. Low CTR points to relevance or creative. High CPC points to auction pressure or loose targeting. Low purchase rate usually sends you back to price, reviews, availability, or the detail page. Don't cut a profitable growth campaign just because it sits above a peer median. Benchmarks tell you where to investigate, not what your margin can support.
Allocating Sponsored Products, Brands, Video, and DSP Across the Funnel
A market-wide budget split can flag an imbalance, but it cannot set your account's budget. Nielsen reports that global sponsored-media budgets are 40% Sponsored Products, 24% Sponsored Brands, 20% display, and 16% video, and that 56% of marketers named money as their biggest Amazon challenge (Nielsen's retail media analysis). Treat these figures as context, not a prescription. Your catalog, margins, and brand awareness determine where another dollar can produce value.
Rising media costs make marginal contribution profit the right allocation test. Move budget toward the funnel role where additional spend is most likely to generate profitable, incremental demand. First confirm the ASIN is in stock, retail ready, and able to convert more traffic.
Channel Allocation Decision Matrix
| Channel | Funnel stage | Default share | Lead question |
|---|---|---|---|
| Sponsored Products | Capture and conversion | 40% | Does this query produce profitable orders and support rank? |
| Sponsored Brands | Consideration and branded demand | 24% | Does it grow branded search or defend category entry points? |
| Display and DSP | Audience expansion and retargeting | 20% | Does it reach shoppers Sponsored Products cannot efficiently reach? |
| Video | Consideration and product education | 16% | Does it improve assisted purchase paths and downstream search? |
Use the default shares as a planning reference only. A new brand with limited awareness may need more Sponsored Brands and video to build consideration before Sponsored Products can capture enough demand. A mature brand with strong organic rank may need less broad discovery and more focused defense. For thin-margin brands, protect efficient harvesting first and fund upper-funnel tests from proven hero ASINs.
Fund Marginal Profit, Not Channel Habit
Set a distinct budget rule for each role. Protect harvesting while it stays within the contribution ceiling. Give discovery a defined test pool, then move queries that show promise into controlled exact-match campaigns. Keep defense funded where competitor conquesting or brand leakage is visible. Test bid reductions carefully: lower spend can also mean lost search share and weaker organic rank.
DSP and off-site media need controls for reach, frequency, and audience. Use a holdout where possible. Platform-attributed sales alone cannot establish incrementality, so assess whether exposed audiences produce contribution beyond what the brand would have earned without the campaign.
Practical rule: Before scaling a channel, name the ASIN margin, inventory cover, campaign role, and customer type the extra spend is meant to reach.
In budget reviews, compare channels by their marginal contribution and effect on demand, not by last-click ACoS alone. Search Query Performance can show whether paid activity is associated with a larger share of query impressions, clicks, carts, and purchases. AMC can help examine the customer paths behind those outcomes. Together, they make the allocation decision about contribution and funnel growth, not merely which ad type reports the lowest ACoS.
Connecting PPC to Organic Rank and Incrementality
Search Query Performance is where paid and organic stop being separate conversations. Amazon states that the dashboard reports impressions, clicks, cart adds, and purchases, compares a selected ASIN with the top 10 ASINs, and can help align listing keywords with customer interests. The Brand view includes organic and Sponsored Products traffic from search results. Query Detail shows how your ASIN performs within a specific query using a Query ASIN score built from the same funnel metrics.
Read the funnel in sequence. Strong impressions with weak clicks suggest relevance, image, price, or review problems. Clicks and cart adds without purchases point to detail-page friction, delivery promise, variant confusion, or an uncompetitive offer. Purchases concentrated in branded queries tell you the account is harvesting existing demand. Growth in non-branded clicks, carts, and purchases is stronger evidence that advertising is expanding your share of the search funnel.
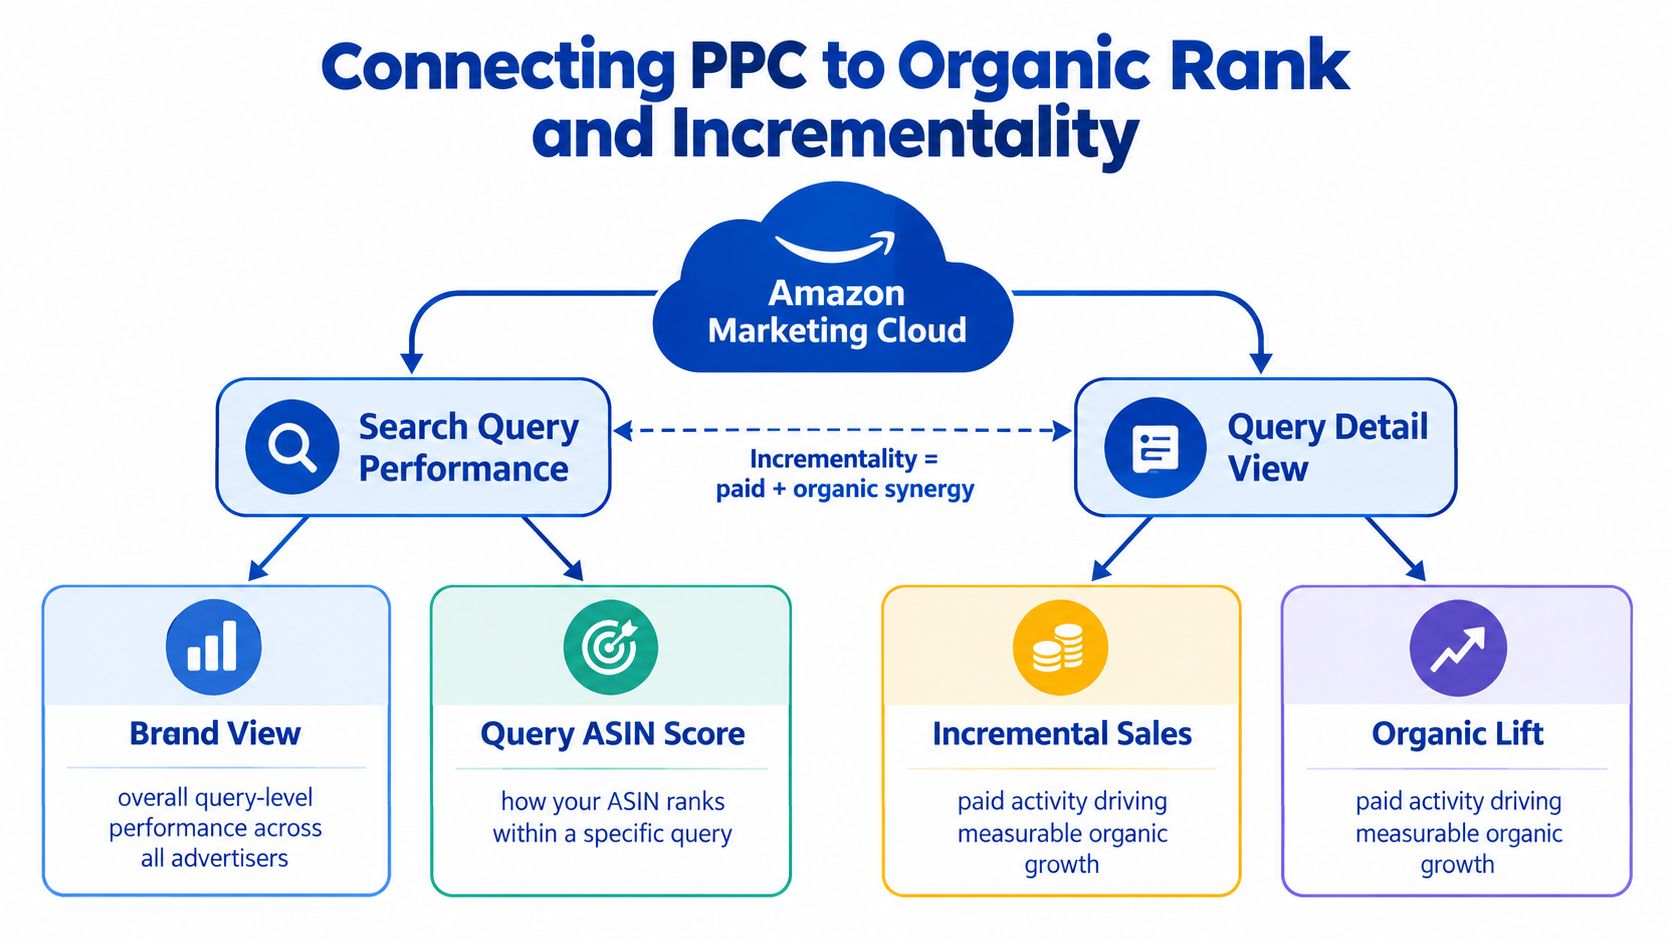
Amazon Marketing Cloud adds the customer and path view that standard campaign reports miss. Use it to separate repeat buyers from new-to-brand buyers, inspect assisted paths across Sponsored Products, Sponsored Brands, video, and DSP, and test whether exposure changes purchase behavior. Pair those findings with Search Query Performance so audience insight connects back to actual Amazon search demand. This is also where an Amazon Marketplace strategy becomes measurable beyond platform ROAS.
What the Case Evidence Shows
Amazon's SkinInspired case is a clean example of PPC funding organic improvement. Amazon reports that clicks rose 596%, ACoS fell 14%, ROAS reached 170%, and the hero product rank improved from 200 to 20. Organic sales increased from 5% to 30% of total sales, total sales rose 667%, and new-to-brand customers increased 1,290%, according to the same case study. The point isn't the headline growth. It's that paid efficiency, rank, organic mix, and customer acquisition moved together.
HP shows the upper-funnel version. Amazon reports that HP increased Sponsored Brands video investment 206% year over year, while organic branded-keyword volume rose 17% for printers, 10% for supplies, and 30% for laptops. Revenue grew 80% and units sold rose 60%, and purchase paths containing Sponsored Brands video showed materially higher purchase rates and ROAS than comparison paths. Judge video by branded demand, assisted paths, and downstream conversion, not only last-click sales.
Your operating decision is to shift budget toward queries and audiences where paid visibility improves conversion and your share of impressions, clicks, carts, and purchases. If paid activity only buys orders you'd win organically, harvest leaner. If it expands funnel share and new customers, it may deserve a higher ACoS than your account average.
Designing A/B Tests That Actually Move Decisions
Most Amazon tests fail before launch because nobody defines the decision. Write down the change, expected effect, success threshold, budget, runtime, and action you'll take if the challenger wins or loses. If the result won't change spend, bids, creative, or listing content, don't run it.
Use this checklist to keep control and challenger structures comparable.
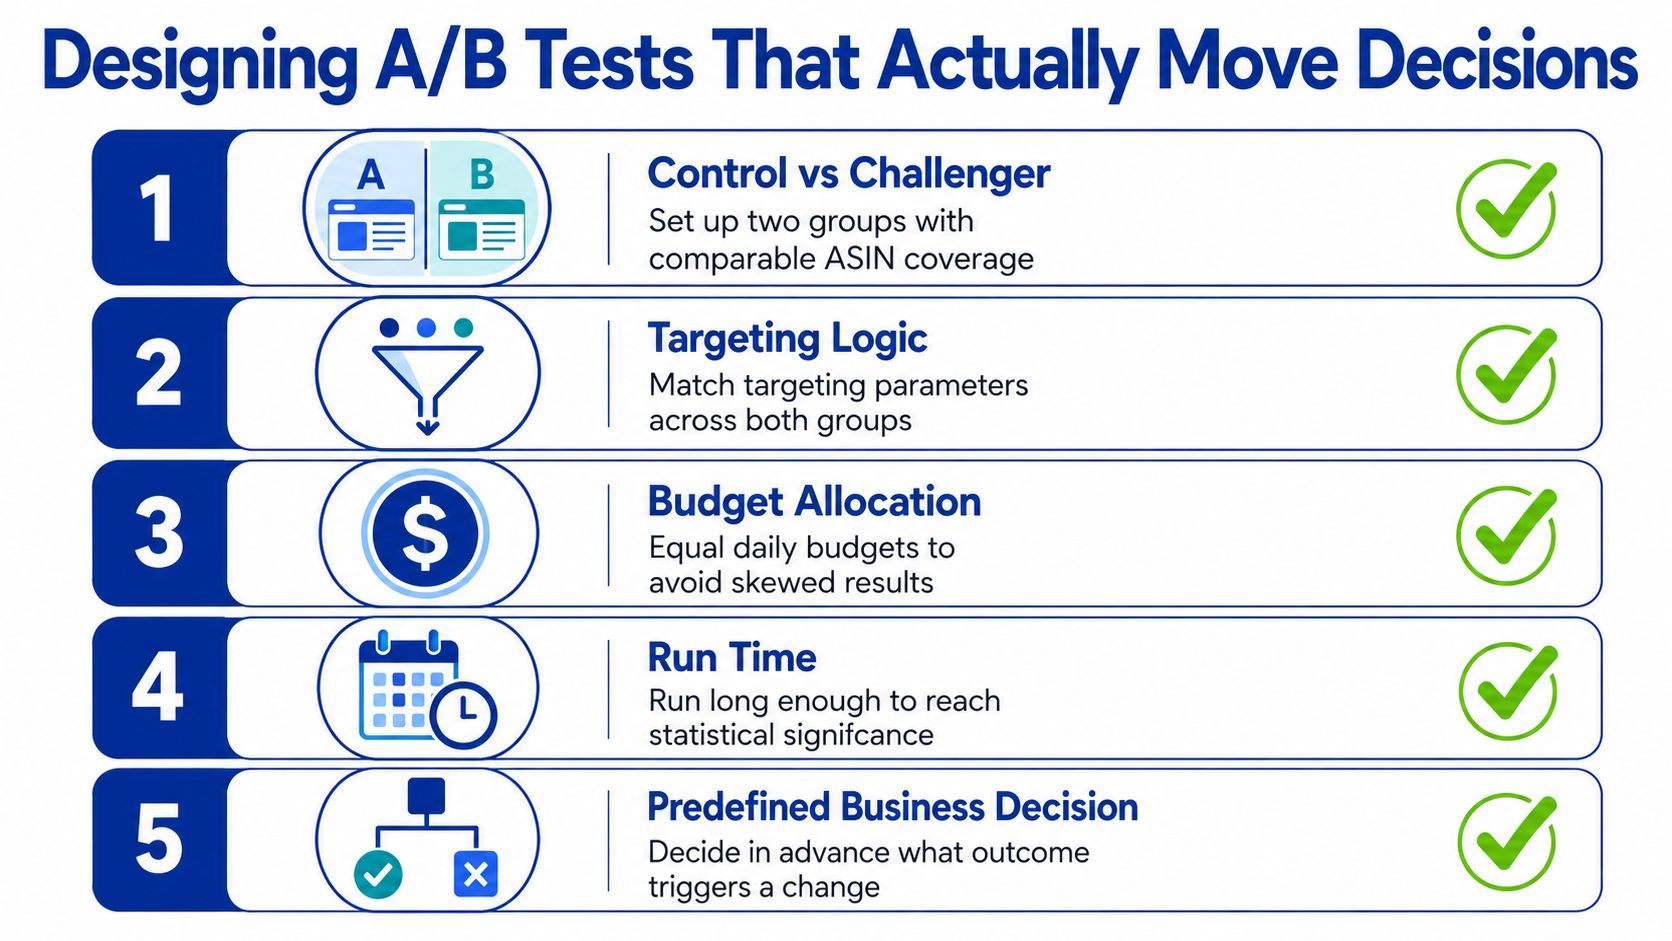
Match ASIN coverage, targeting logic, match types, placements, budgets, and runtime as closely as the account allows. Change one meaningful variable at a time. Changing bids, creative, price, and listing copy together might produce a result, but you won't know which lever caused it. That knowledge gap becomes expensive when you try to scale the supposed winner.
Separate Advertising Conversion From Detail Page Conversion
Amazon attributes ad purchases within a defined click-based window. Detail-page conversion reflects broader traffic, including organic visits, repeat shoppers, external traffic, and shoppers who saw an ad earlier. Conflating the two produces false conclusions. A listing improvement can lift detail-page conversion while a campaign still targets weak queries. A targeting improvement can raise ad conversion while the overall page remains constrained by price or reviews.
Read tests against the 28-day active baseline and 90-day trend, and investigate deviations beyond two standard deviations rather than reacting to ordinary daily volatility. Let tests collect enough traffic before calling them. Stopping early because day three looks ugly is how teams kill discovery and overfit to branded harvesting.
Amazon provides directional reasons to test both ads and brand destinations. It reports that sellers adopting Sponsored Products averaged 34% more sales growth four weeks after adoption, while Brand Store visitors purchased 53.9% more frequently and had 71.3% higher average order value than shoppers who didn't visit one. Treat those figures as directional benchmarks, not guaranteed returns. Your test still has to prove the effect in your category, at your margin, with your ASINs.
Keep a Decision Log
For every intervention, record ASIN, query or audience, campaign role, start and end dates, spend, incremental sales estimate, contribution profit, branded versus non-branded demand, new-to-brand result, Search Query Performance movement, and organic rank. Then write the decision in plain language. Scale, hold, revise, or stop. A useful test leaves behind a reusable rule, not just a screenshot of ROAS.
Retail-Readiness Signals That Decide Whether PPC Works
Weak retail readiness makes good campaigns look wasteful. If inventory is thin, the Buy Box is unstable, price is uncompetitive, reviews lag the category, or the main image doesn't communicate the product quickly, paid clicks leak. Lowering bids may reduce spend, but it doesn't fix the reason shoppers didn't buy.
Cost pressure makes those leaks harder to forgive. In a January 2025 survey, 38% of nearly 1,500 sellers cited higher shipping costs and 32% cited rising advertising expenses as major challenges. That combination means brands can't afford to send expensive traffic to pages that convert below their potential. Operations and media now share the same margin problem.
Audit These Signals Before Touching Bids
- Inventory coverage: Pause or restrain scale when stock can't support sales velocity and replenishment timing.
- Buy Box status: Check ownership, delivery promise, seller performance, and price position against the current winner.
- Price competitiveness: Compare the full offer with the top alternatives shoppers see on the same search page.
- Reviews and ratings: Look at rating, review depth, recent velocity, and recurring complaints that ads will expose faster.
- Images and A+ content: Confirm the hero image earns the click, supporting images answer objections, and A+ content clarifies fit, use, sizing, compatibility, or ingredients.
- Brand Store path: Send upper-funnel traffic to a Store that organizes the range logically instead of dropping every shopper on one detail page.
For apparel, imagery is often the fastest readiness fix because fit, drape, colour, and styling decide the click before copy gets read. A focused ai photoshoot for clothing brand workflow can be relevant when you need consistent on-model or lifestyle assets across variants, but the standard remains the same. Test whether new creative improves CTR and purchase rate in Search Query Performance and campaign data, not whether the team likes the photos.
Fix the page that wastes the click before you punish the campaign that bought it.
Run this audit weekly for ASINs receiving meaningful spend. When purchase rate falls, check stock, Buy Box, price, reviews, and content before bid changes. Half of supposed PPC problems become operational tickets once you read the signals in that order.
The 90-Day Operating Rhythm and What to Hand Off
Amazon built this marketplace on shared demand. Amazon launched Auctions in March 1999, zShops in September 1999, and Marketplace in November 2000, then reported that monthly Marketplace gross merchandise sales had more than tripled in the first four months, reaching more than 30 million customers. The lesson still holds. Demand already exists on shared product pages and search results. Your job is to capture it profitably and compound that capture into organic visibility.
Days 1 to 30 Reset the Baseline
Calculate break-even economics by priority ASIN. Assign every campaign a role and remove campaigns with no clear job. Audit inventory, Buy Box, pricing, reviews, images, A+ content, and Brand Store paths for advertised ASINs. Build the dashboard around contribution profit, TACoS, Search Query Performance funnel share, organic rank, and new-to-brand demand. Don't scale anything major until the baseline is trustworthy.
Days 31 to 60 Test and Reallocate
Run controlled tests on query expansion, creative, Sponsored Brands video, defensive bids, and DSP audiences. Move budget in deliberate increments toward profitable incremental demand. Retire queries that produce clicks without carts after the landing experience has been fixed. Graduate winners into tightly controlled campaigns and keep discovery separate so learning budgets don't contaminate harvesting performance.
Days 61 to 90 Scale What Compounds
Increase spend where paid sales improve rank, funnel share, and new customer acquisition without breaking contribution limits. Use Amazon Marketing Cloud to verify paths and customer quality, then coordinate PPC, DSP, content, and Brand Store investment around the same hero queries and ASINs. Where growth depends on constant specialists, hand off repeatable execution and keep internal ownership of margin, assortment, pricing, and inventory decisions. An external partner can run campaigns, but your finance and operations teams still own the constraints that make campaigns profitable.
The takeaway is portfolio discipline. Every dollar should be measured against contribution profit, organic share of search, and new-to-brand demand. That's the operating model Headline Marketing Agency runs as one option among specialist Amazon partners, combining PPC and DSP management with Search Query Performance and Amazon Marketing Cloud analysis. Whether you build it internally or with support, stop asking ads to prove value through ACoS alone. Make them prove they build a stronger marketplace business.
If your Amazon spend looks efficient but organic share and profit aren't improving, Headline Marketing Agency can rebuild your PPC and DSP around contribution profit, Search Query Performance, and Amazon Marketing Cloud evidence. Visit the team to discuss a marketplace operating model that funds rank, new customers, and sustainable scale instead of chasing a lower ACoS.
Get Your Free Amazon PPC Audit
Discover untapped growth opportunities and see how our data-driven approach can improve your ROAS.
Get Free Audit →Wollen Sie Ihre Amazon PPC-Performance aufs nächste Level bringen?
Lassen Sie Ihre Amazon PPC-Kampagnen professionell analysieren und entdecken Sie neue Wachstumsmöglichkeiten.