How to Measure Customer Engagement to Drive Profitable Growth
Customer engagement goes beyond reviews. Our guide to customer engagement metrics covers touchpoints that build loyalty and repeat sales.

Measuring customer engagement isn’t about collecting data for a report. It's about drawing a straight line from specific customer actions to revenue and profitability. The right framework moves you beyond vanity metrics and focuses on the bottom-line interactions that signal long-term value and predict future growth.
Moving Beyond Likes and Shares
Genuine customer engagement is the sum of meaningful interactions that tell you where your future revenue is coming from. For eCommerce leaders, the challenge is identifying which actions—from the first ad click to the tenth purchase—flag a customer as a long-term asset. This requires a performance-first mindset, connecting the dots between how customers behave and what your business achieves.
Pivoting from vanity metrics to value-driven indicators is non-negotiable. Instead of just counting comments, you should be digging into how specific interactions affect your core profitability metrics. For instance, an Amazon brand might find that customers who watch their Sponsored Brand videos have a 15% higher Customer Lifetime Value (CLV). This is how engagement data becomes a strategic lever for PPC investments and organic growth. To really get a handle on this and move past surface-level numbers, it's worth exploring comprehensive strategies for measuring customer engagement.
This process flow gives you a look at how a modern eCommerce manager should be analyzing sales data, zeroing in on the true engagement metrics that drive the business forward.
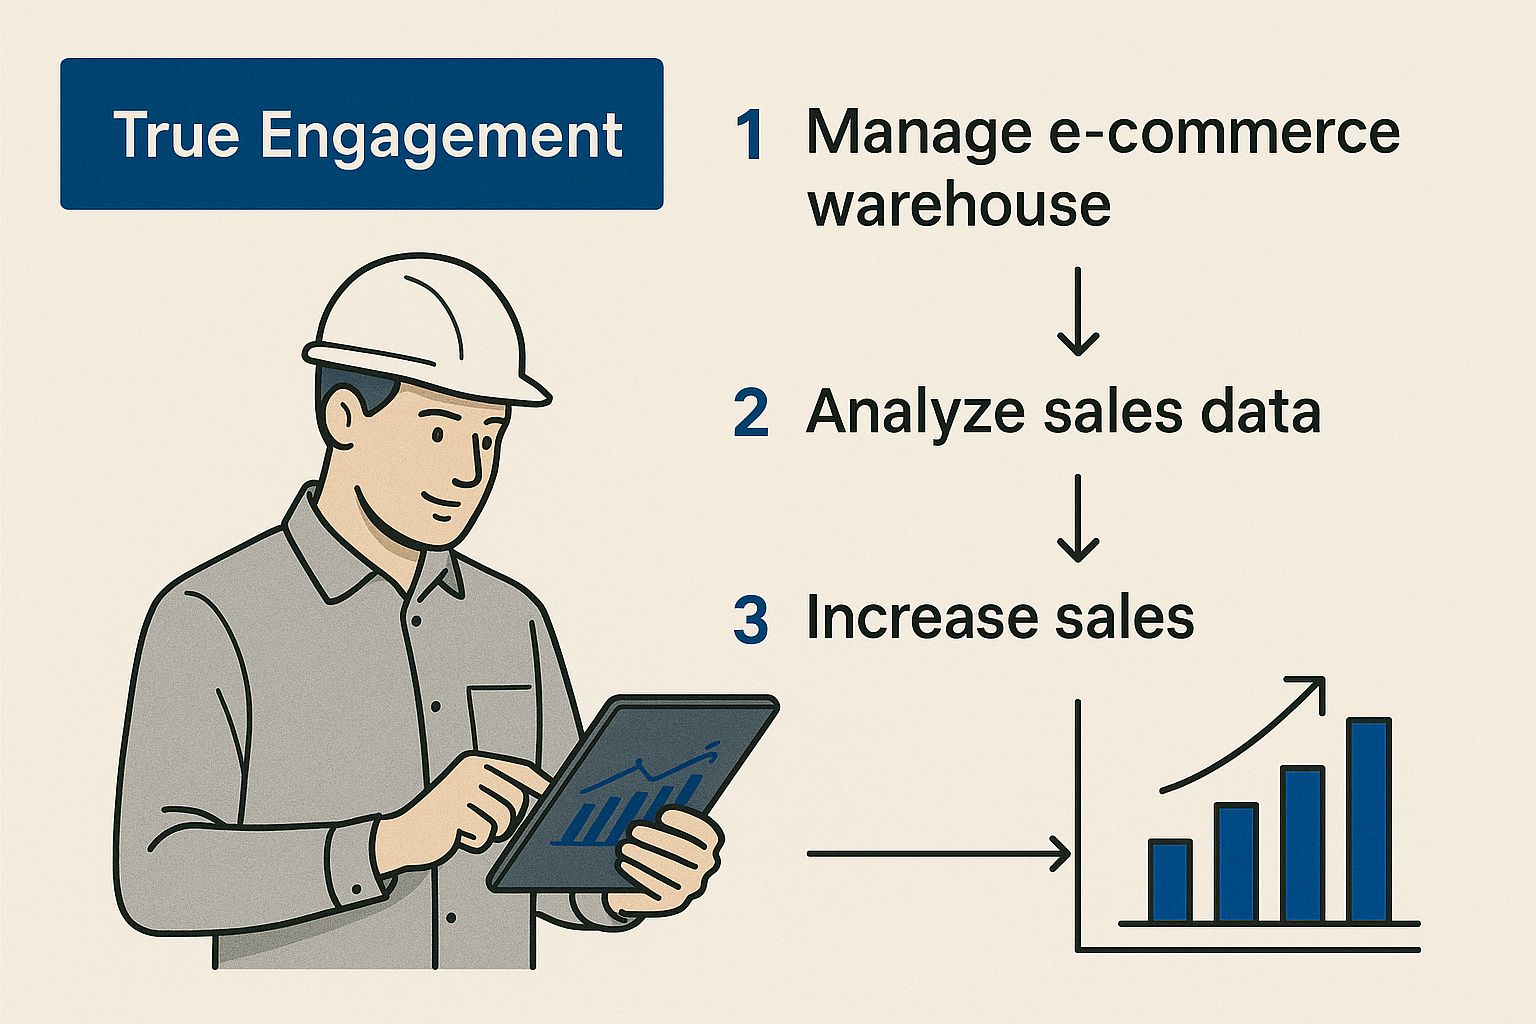
As you can see, successful measurement is all about connecting various customer touchpoints back to core business goals like profitability and retention. It’s a complete picture, not just a snapshot.
Redefining Your Engagement Metrics
The customer journey is fragmented across dozens of touchpoints, which complicates measurement. Consider this: the average engagement rate for a social media post is just 0.71%, but even that is misleading. Photos average 0.59%, while carousels pull in 1.26%. This proves a one-size-fits-all approach is doomed to fail; you must track interactions across the entire journey.
The goal is to build a direct line from customer actions to business impact. Every metric you track should answer a simple question: "How does this contribute to profitable growth?"
This means prioritizing metrics with an undeniable link to your bottom line. Stop obsessing over social reach and start focusing on these performance indicators:
- Repeat Purchase Rate: The ultimate sign of a healthy, engaged customer base. Happy customers drive profitable growth.
- Customer Lifetime Value (CLV): A direct measure of a customer's long-term worth, guiding smarter acquisition spending.
- Product Review Rate: An indicator of active participation that builds crucial social proof, directly influencing conversion rates for new buyers.
Ultimately, understanding these deeper engagement signals allows you to make smarter decisions about your ad spend—knowing which advertising performance metrics actually fuel sustainable growth.
Building Your Engagement Measurement Framework
You can't just track everything and hope for insight. A solid measurement framework is your roadmap—it helps you focus on the customer actions that tie directly to your business goals. It's the difference between drowning in data and having a clear, purposeful system that tells you what's working.
The most practical way to do this is by mapping metrics to the customer lifecycle: Awareness, Consideration, Purchase, Retention, and Advocacy. By assigning the right Key Performance Indicators (KPIs) to each stage, you get a holistic view of the customer journey, not just isolated data points.
For example, a high "add to cart" rate is promising, but what does it really mean? When viewed alongside your "repeat purchase rate," the story becomes clearer. Are you skilled at securing the first sale, or are you building a base of loyal, high-value customers? That's the kind of strategic insight a good framework provides.
Aligning Metrics With Business Goals
First, define your objective at each stage of the funnel. Are you fighting for brand visibility, trying to nail the first sale, or building a tribe of loyal advocates? Your answer points you directly to the metrics that matter most.
Let's say you're an Amazon seller launching a new product. Your world revolves around Awareness. You’ll be glued to your PPC campaign dashboard, watching metrics like:
- Impressions and Click-Through Rate (CTR) on your Sponsored Brands ads to gauge initial interest.
- Search Query Performance to ensure your paid traffic is relevant and high-intent.
- New-to-Brand metrics to confirm you're reaching new shoppers, not just remarketing to existing customers.
But if you’re an established brand, your focus shifts downstream to Retention and Advocacy. The health of your business is better measured by Customer Lifetime Value (CLV) or the adoption rate of Subscribe & Save. These are the numbers that signal sustainable, profitable scale.
The rule of thumb is simple: every metric needs a job. If you can't explain how a KPI helps you make a better decision about your ad spend, product, or customer service, it doesn't deserve a spot on your dashboard.
Thinking this way forces you to be strategic. You're no longer just collecting data; you're measuring engagement in a way that directly fuels growth.
A Practical Framework For Your Brand
To cut through the noise and avoid chasing vanity metrics, create a simple table. This exercise is incredibly clarifying. It draws a straight line from a customer click to a business outcome, making it obvious how your PPC and organic efforts are hitting the bottom line.
Here’s a simple framework to get you started. It maps key engagement metrics to each stage of the customer funnel, connecting them to a primary business goal and a real-world measurement.
Customer Engagement KPI Framework by Funnel Stage
| Funnel Stage | Primary Business Goal | Key Engagement Metric | Example Measurement |
|---|---|---|---|
| Awareness | Increase Brand Visibility | Ad-driven Session Starts | Number of unique sessions originating from a Sponsored Display ad click. |
| Consideration | Drive Product Evaluation | Add to Cart Rate | Percentage of visitors who add a specific product to their cart. |
| Purchase | Maximize Initial Sales | Conversion Rate (CVR) | The percentage of sessions that result in a completed purchase. |
| Retention | Encourage Repeat Business | Repeat Purchase Rate | The percentage of customers who make a second purchase within 90 days. |
| Advocacy | Foster Brand Loyalty | Product Review Rate | Percentage of purchasers who leave a product review within 30 days. |
Think of this framework as more than just a reporting tool—it’s a decision-making engine. It gives you the clarity to fine-tune your ad campaigns, improve your product listings, and build an engaged customer base that leads to real, profitable growth.
The Core Metrics That Drive Profitability
Once your framework is set, it’s time to get laser-focused on the metrics that actually impact your bottom line. It's easy to get lost in a sea of data. I've seen countless brands track dozens of "vanity metrics" that look great on a report but do little for the business. If you're serious about sustainable growth, you must cut through the noise.

This means shifting your mindset from chasing short-term wins to building long-term value. Sure, a high conversion rate on a one-off campaign is nice, but a consistently high Customer Lifetime Value (CLV) is what truly builds an unbreakable brand.
Beyond the First Purchase: CLV and Churn Rate
For any eCommerce leader, Customer Lifetime Value (CLV) should be your north star. It’s the total profit you can expect from a customer over their entire relationship with your brand. A rising CLV is the clearest sign that your engagement strategies—and your PPC investments—are hitting the mark.
For example, an Amazon seller might discover that customers acquired through a Sponsored Brand video ad have a 20% higher CLV than those who clicked a standard product ad. That’s a powerful insight that tells you exactly where to allocate ad dollars for the best long-term return. Getting a firm grip on CLV is also key to understanding your true return on investment. If you want to dive deeper, we have a whole guide on how to calculate marketing ROI.
The other side of the CLV coin is your Churn Rate—the percentage of customers who walk away over a given period. For subscription businesses, this is straightforward. For other models, you might define churn as a customer not purchasing again within a 90 or 180-day window. A high churn rate is a massive red flag that something's wrong with your product, customer experience, or perceived value.
A low churn rate isn't just a retention metric; it's a profitability lever. Remember, acquiring a new customer is anywhere from 5 to 25 times more expensive than keeping an existing one. Every customer you prevent from churning directly improves your bottom line.
Leading Indicators of Loyalty: NPS and TTV
While CLV and churn are "lagging indicators"—they tell you what already happened—you also need metrics that help you predict what's going to happen. That’s where Net Promoter Score (NPS) and Time to Value (TTV) come into play. These are your early warning system.
Net Promoter Score (NPS) gauges loyalty by asking one simple question: "How likely are you to recommend our brand to a friend or colleague?" A high NPS is a sign that you're creating true brand advocates who will generate powerful (and free) word-of-mouth marketing for you.
Time to Value (TTV) is a less-talked-about but incredibly important metric. It measures how quickly a new customer experiences the core benefit of your product. For an electronics brand, this might be the time from unboxing to successful setup. For a supplement company, it's the time until the customer feels a tangible difference.
Reducing your TTV is one of the most effective retention strategies. When a customer quickly sees the value in what they bought, they're far more likely to come back for more. This makes TTV a powerful predictor of long-term engagement and, ultimately, profitability.
Choosing Your Tech Stack for Accurate Measurement
Turning a mountain of raw data into actionable intelligence comes down to your tech stack. Without the right tools, you're just guessing—making strategic bets based on gut feelings instead of real customer behavior.
Building a great stack isn't about collecting the most expensive logos. It's about creating a single source of truth for all customer behavior without overcomplicating your operations. The goal is to get your web analytics, CRM, and eCommerce platform to play nicely together. When they do, you can finally see the full story—from the first ad click to the final purchase and every step in between.
From Basic Analytics to a Single Source of Truth
Most brands start with Google Analytics. It’s free, powerful, and the perfect place to get your feet wet with on-site behavior like session duration and pages per session. These are foundational metrics that tell you if people are even remotely interested in what you have to offer.
Here’s a look at a standard Google Analytics dashboard, giving you that top-level view of how users are interacting with your site over time.
This is a great starting point, but it's just that—a start.
To achieve the deep understanding that drives profit, you need to layer in other platforms. Tools like a Customer Data Platform (CDP) or specialized eCommerce dashboards become invaluable. A good CDP acts as a central hub, pulling data from your website, email campaigns, and PPC ads, and tying it all to a single customer profile.
Suddenly, you have a 360-degree view of each person. For example, by leveraging Amazon Marketing Cloud, a seller can see how a shopper's exposure to both a video ad and a sponsored product ad ultimately led to a purchase—an insight you can't get from one tool alone. This allows you to use PPC as a true lever for organic growth by understanding the full customer journey.
Don’t fall into the data silo trap. An integrated tech stack is the only way to avoid a fragmented, confusing picture of your customers. Your tools should create clarity, not more chaos.
This unified approach is absolutely critical for accurate attribution. If you want to know which channels are actually bringing you valuable, engaged customers, you need a system that can track the entire messy journey. For a much deeper dive on this, check out our guide to cross-channel marketing attribution, where we break down how to connect all those touchpoints to real conversions.
Selecting Tools That Fit Your Scale
The tech you need today won't be the tech you need in two years. A startup can get significant mileage out of Google Analytics and native reporting from its ad platforms. But as you grow, you'll hit a wall and require something more powerful.
As you build out your stack, consider exploring dedicated engagement tracking solutions that go beyond standard analytics. The key is to evaluate every potential tool against a few simple criteria:
- Integration Capability: How easily does it plug into the systems you already use? A tool that creates more manual work is a step backward.
- Actionable Insights: Does it provide clear, straightforward data that helps you make a decision, or does it just spit out more numbers?
- Scalability: Will this tool grow with you? Think about where you want to be in one, three, and five years.
Picking your tech isn't just an IT task; it’s a core business decision that directly shapes your ability to understand your customers and grow your company profitably.
Turning Engagement Insights Into Action
Collecting data is the easy part. Where most brands fail is turning those dashboards into decisive action.
Seeing your repeat purchase rate dip isn't just a number on a chart; it's a warning sign that customer relationships are weakening, which directly hits your bottom line. Data is only useful when it forces you to ask tough questions and make better decisions.
This is where a "performance-first" mindset is critical. You must stop reporting metrics and start interpreting them as clear directives. Every data point should spark a "so, what's next?" conversation, closing the gap between measurement and real growth.

From Diagnosis to Actionable Strategy
Let’s get practical. Imagine your data reveals two things: your Repeat Purchase Rate is slipping, and your Net Promoter Score (NPS) is high, but only among a specific customer segment on the West Coast. These aren't just interesting facts; they’re your marching orders.
Here’s how you translate those insights into smart moves:
Tackle the Declining Repeat Rate: A drop in repeat business often points to a post-purchase problem. Is your Time to Value (TTV) too long? A great move is to launch a targeted email and SMS campaign that kicks in 7 days after delivery with setup tips or use cases. This shortens the TTV and reinforces the purchase decision.
Capitalize on Your High NPS: That high-NPS segment is your ideal customer profile. Immediately use this data to refine your Amazon Sponsored Display ad targeting. Build lookalike audiences based on that West Coast demographic. You're no longer guessing; you're focusing ad spend on acquiring customers who are statistically primed to become loyal advocates.
Actionable insight is all about connecting the dots. A single metric is just noise. But when you pair it with another, it becomes a strategic roadmap for optimizing ad spend and improving customer retention.
A Framework for Proactive Adjustments
To get results from your data consistently, you need a system. Don't wait for the quarterly business review to make a change. You need a nimble feedback loop that lets you test, learn, and adapt based on what your engagement metrics are telling you right now.
Consider this proactive approach for an Amazon brand:
- Isolate the Metric: You notice your Add to Cart Rate is high, but your Conversion Rate is low for a top product.
- Formulate a Hypothesis: Customers are interested, but something on the product detail page is causing hesitation—perhaps shipping time, a lack of reviews, or a confusing description.
- Deploy a Targeted Test: Run an A/B test on your A+ Content. Version A highlights product features, while Version B focuses on customer testimonials and user-generated photos to build trust.
- Measure the Impact: Monitor the conversion rate for both versions over two weeks to identify the winner.
This simple, iterative process shifts you from a passive data-watcher to an active problem-solver. This is how you build sustainable, profitable growth—not just by running ads, but by building a smarter, more responsive business based on how customers actually behave.
Common Questions About Measuring Engagement
Even with a solid plan, practical questions will arise as you dig into the data. Let's walk through some of the most common hurdles eCommerce leaders face when moving from theory to implementation.
How Can I Measure Engagement With a Small Budget?
You don't need an expensive tech stack to get started. The key is to be resourceful and focus on the data you already have. Prioritize the few metrics with the biggest impact, rather than trying to track everything.
Start with the analytics tools built into your existing platforms. If you’re an Amazon seller, Brand Analytics provides incredible data on repeat purchase behavior and customer demographics for free. For D2C brands, Shopify's native reporting is a great place to track metrics like Average Order Value and Customer Lifetime Value.
Then, layer on powerful free tools:
- Google Analytics is non-negotiable for monitoring on-site behavior like Time on Site and Pages per Session.
- Simple surveys using tools like Google Forms are perfect for calculating a basic Net Promoter Score (NPS) to get a pulse on customer loyalty.
Focus on mastering a few core metrics first. This lean approach enables smart, data-backed decisions without a huge investment.
What Is the Difference Between Engagement and Satisfaction?
This is a critical distinction. Customer satisfaction measures how a customer feels about a past transaction. It's a backward-looking metric, often captured with a CSAT score immediately after a purchase or support interaction.
Customer engagement, on the other hand, is a forward-looking indicator. It helps predict future behavior and reveals the long-term health of your customer relationships.
Satisfaction asks, "Were you happy with that one thing?" Engagement asks, "How likely are you to interact with us again, buy from us again, and tell your friends about us?" An engaged customer is almost always satisfied, but a satisfied customer isn't necessarily engaged.
Engagement is about the voluntary actions customers take—like leaving a review without being prompted or joining a loyalty program. These actions signal a deeper connection and point to a higher lifetime value.
How Often Should I Review These Metrics?
The right cadence depends on the metric. Reviewing everything daily is a fast track to burnout and analysis paralysis.
Here’s a practical schedule that works for most businesses:
- Weekly Check-in: For fast-moving, top-of-funnel metrics. Look at on-site engagement (Time on Site, bounce rate) and ad campaign performance (CTR, Conversion Rate). These are your canaries in the coal mine, flagging immediate issues or opportunities.
- Monthly & Quarterly Review: For bigger, strategic metrics. This is when you analyze your Customer Lifetime Value (CLV), Churn Rate, and Repeat Purchase Rate. These numbers move slower, but they reveal the true health of your business and show whether your long-term strategies are working.
By tying these reviews to your regular business planning, you ensure the insights you find actually turn into action, instead of just sitting in a report.
Ready to stop guessing and start growing? At Headline Marketing Agency, we transform engagement data into profitable, sustainable growth on Amazon. Let's build your strategy.
Get Your Free Amazon PPC Audit
Discover untapped growth opportunities and see how our data-driven approach can improve your ROAS.
Get Free Audit →Ready to Transform Your Amazon PPC Performance?
Get a comprehensive audit of your Amazon PPC campaigns and discover untapped growth opportunities.